
- Start >
- Rivers >
- Discharge >
- Inn >
- Weichselbaum >
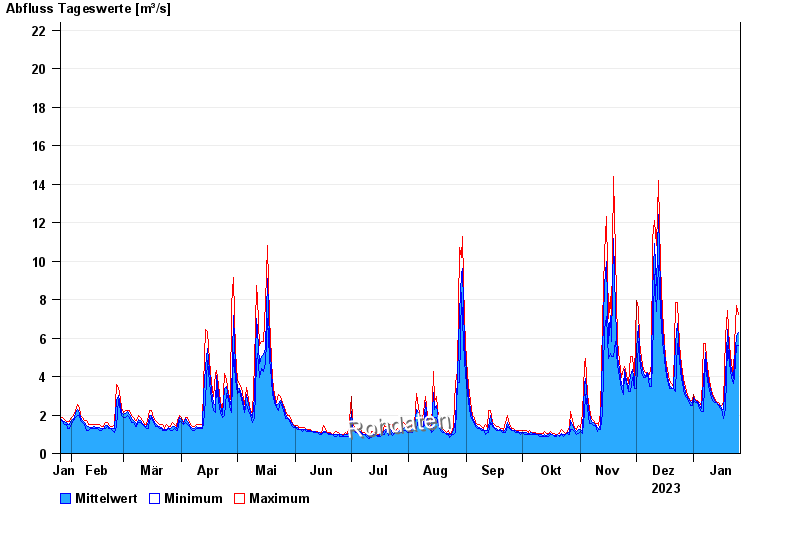
- Chart of year

Chart of year Weichselbaum / Murn
Discharge from 26.01.2023 to 25.01.2024
- 02.06.2013 Abfluss: 71,5 m³/s
- 02.08.1991 Abfluss: 41,7 m³/s
- 03.06.2010 Abfluss: 39,8 m³/s
- 21.05.1999 Abfluss: 39,8 m³/s
- 02.06.1995 Abfluss: 37,1 m³/s
| Date | Mean value [m³/s] | Maximum [m³/s] | Minimum [m³/s] |
|---|---|---|---|
| 25.01.2024 | 6.27 | 7.2 | 5.61 |
| 24.01.2024 | 6.15 | 7.67 | 5.59 |
| 23.01.2024 | 4.8 | 5.72 | 3.94 |
| 22.01.2024 | 3.89 | 4.09 | 3.63 |
| 21.01.2024 | 4.31 | 4.66 | 3.94 |
| 20.01.2024 | 5.1 | 5.59 | 4.66 |
| 19.01.2024 | 6.47 | 7.44 | 5.59 |
© Bayerisches Landesamt für Umwelt 2024