
- Start >
- Rivers >
- Discharge >
- Inn >
- Weichselbaum >
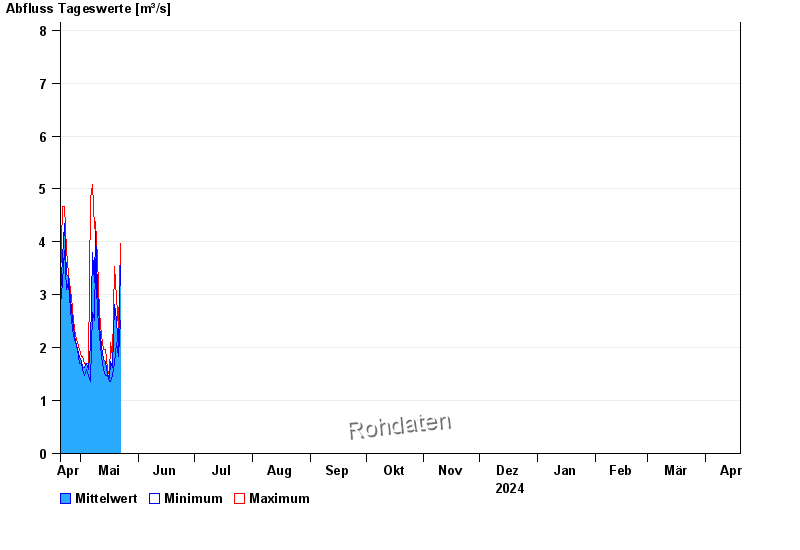
- Chart of year

Chart of year Weichselbaum / Murn
Discharge from 20.04.2024 to 19.04.2025
- 02.06.2013 Abfluss: 71,5 m³/s
- 02.08.1991 Abfluss: 41,7 m³/s
- 03.06.2010 Abfluss: 39,8 m³/s
- 21.05.1999 Abfluss: 39,8 m³/s
- 02.06.1995 Abfluss: 37,1 m³/s
| Date | Mean value [m³/s] | Maximum [m³/s] | Minimum [m³/s] |
|---|---|---|---|
| 02.05.2024 | 1.71 | 1.71 | 1.71 |
| 01.05.2024 | 1.73 | 1.83 | 1.71 |
| 30.04.2024 | 1.83 | 1.96 | 1.71 |
| 29.04.2024 | 1.96 | 2.09 | 1.96 |
| 28.04.2024 | 2.12 | 2.23 | 2.09 |
| 27.04.2024 | 2.38 | 2.51 | 2.23 |
| 26.04.2024 | 2.73 | 2.95 | 2.51 |
© Bayerisches Landesamt für Umwelt 2024