

Chart of year Weg / Isen
Discharge from 25.10.2020 to 24.10.2021
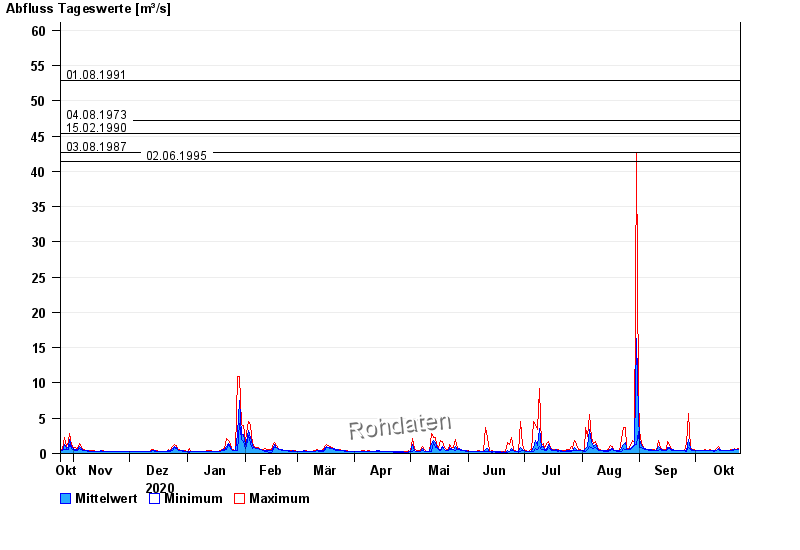
- 01.08.1991 Abfluss: 52,8 m³/s
- 04.08.1973 Abfluss: 47,2 m³/s
- 15.02.1990 Abfluss: 45,3 m³/s
- 03.08.1987 Abfluss: 42,6 m³/s
- 02.06.1995 Abfluss: 41,4 m³/s
| Date | Mean value [m³/s] | Maximum [m³/s] | Minimum [m³/s] |
|---|---|---|---|
| 24.10.2021 | 0.606 | 0.672 | 0.571 |
| 23.10.2021 | 0.592 | 0.602 | 0.543 |
| 22.10.2021 | 0.634 | 0.71 | 0.543 |
| 21.10.2021 | 0.536 | 0.571 | 0.493 |
| 20.10.2021 | 0.483 | 0.518 | 0.47 |
| 19.10.2021 | 0.467 | 0.493 | 0.403 |
| 18.10.2021 | 0.421 | 0.448 | 0.403 |
© Bayerisches Landesamt für Umwelt 2024