

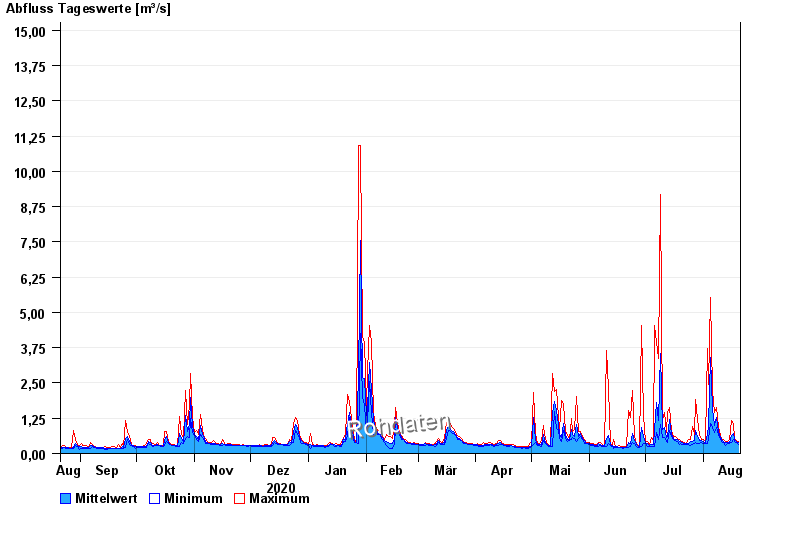
Chart of year Weg / Isen
Discharge from 21.08.2020 to 20.08.2021
- 01.08.1991 Abfluss: 52,8 m³/s
- 04.08.1973 Abfluss: 47,2 m³/s
- 15.02.1990 Abfluss: 45,3 m³/s
- 03.08.1987 Abfluss: 42,6 m³/s
- 02.06.1995 Abfluss: 41,4 m³/s
| Date | Mean value [m³/s] | Maximum [m³/s] | Minimum [m³/s] |
|---|---|---|---|
| 20.08.2021 | 0.388 | 0.42 | 0.326 |
| 19.08.2021 | 0.425 | 0.466 | 0.396 |
| 18.08.2021 | 0.493 | 0.538 | 0.42 |
| 17.08.2021 | 0.701 | 1.01 | 0.513 |
| 16.08.2021 | 0.622 | 1.17 | 0.396 |
| 15.08.2021 | 0.395 | 0.513 | 0.349 |
| 14.08.2021 | 0.379 | 0.442 | 0.349 |
© Bayerisches Landesamt für Umwelt 2024