

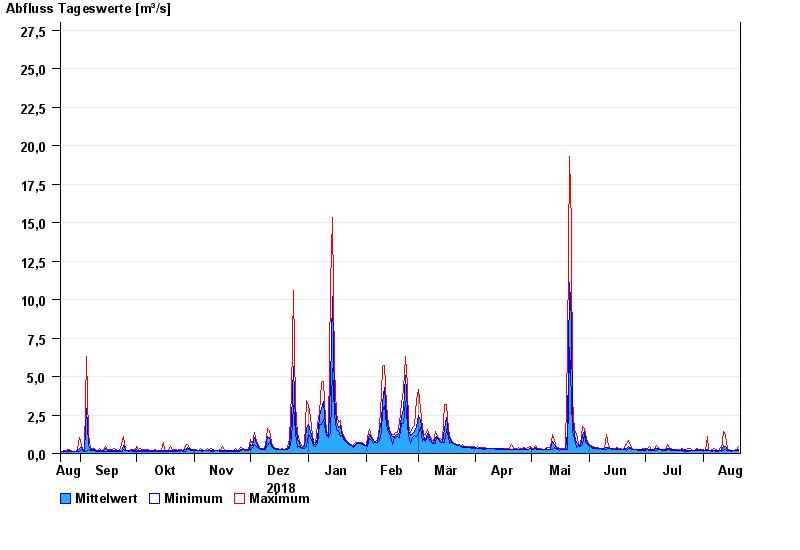
Chart of year Weg / Isen
Discharge from 21.08.2018 to 20.08.2019
- 01.08.1991 Abfluss: 52,8 m³/s
- 04.08.1973 Abfluss: 47,2 m³/s
- 15.02.1990 Abfluss: 45,3 m³/s
- 03.08.1987 Abfluss: 42,6 m³/s
- 02.06.1995 Abfluss: 41,4 m³/s
| Date | Mean value [m³/s] | Maximum [m³/s] | Minimum [m³/s] |
|---|---|---|---|
| 20.08.2019 | 0.246 | 0.458 | 0.184 |
| 19.08.2019 | 0.225 | 0.271 | 0.176 |
| 18.08.2019 | 0.192 | 0.216 | 0.167 |
| 17.08.2019 | 0.2 | 0.216 | 0.176 |
| 16.08.2019 | 0.208 | 0.226 | 0.153 |
| 15.08.2019 | 0.223 | 0.238 | 0.208 |
| 14.08.2019 | 0.267 | 0.328 | 0.208 |
© Bayerisches Landesamt für Umwelt 2024