

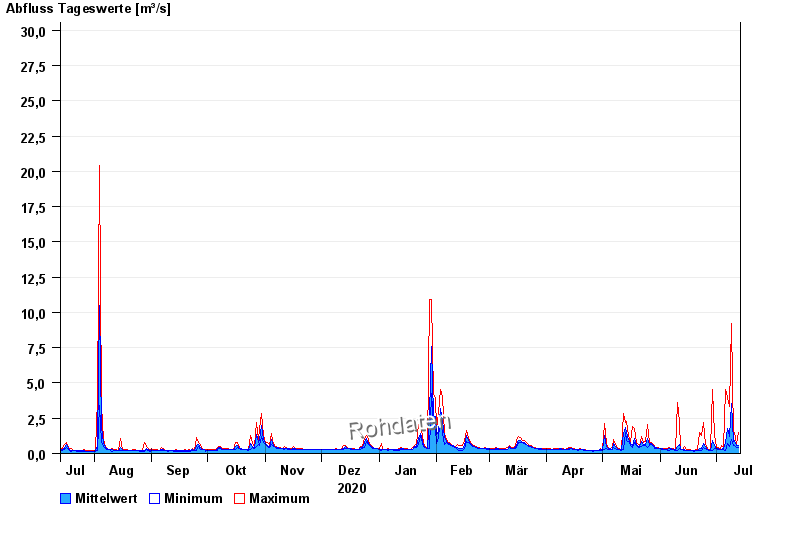
Chart of year Weg / Isen
Discharge from 14.07.2020 to 13.07.2021
- 01.08.1991 Abfluss: 52,8 m³/s
- 04.08.1973 Abfluss: 47,2 m³/s
- 15.02.1990 Abfluss: 45,3 m³/s
- 03.08.1987 Abfluss: 42,6 m³/s
- 02.06.1995 Abfluss: 41,4 m³/s
| Date | Mean value [m³/s] | Maximum [m³/s] | Minimum [m³/s] |
|---|---|---|---|
| 13.07.2021 | 0.595 | 1.46 | 0.394 |
| 12.07.2021 | 0.556 | 0.727 | 0.413 |
| 11.07.2021 | 0.93 | 1.46 | 0.572 |
| 10.07.2021 | 0.834 | 1.17 | 0.572 |
| 09.07.2021 | 3.55 | 9.19 | 1.01 |
| 08.07.2021 | 1.17 | 3.35 | 0.508 |
| 07.07.2021 | 1.8 | 3.94 | 0.727 |
© Bayerisches Landesamt für Umwelt 2024