

Chart of year Weg / Isen
Discharge from 08.05.2021 to 07.05.2022
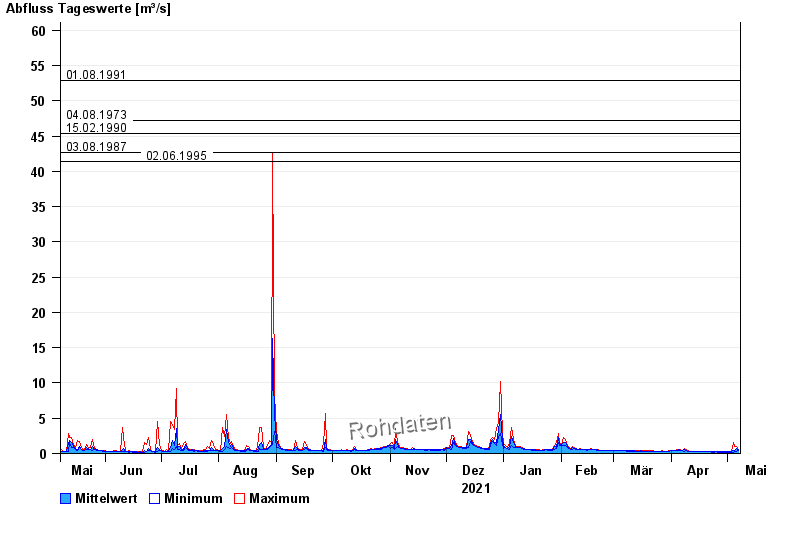
- 01.08.1991 Abfluss: 52,8 m³/s
- 04.08.1973 Abfluss: 47,2 m³/s
- 15.02.1990 Abfluss: 45,3 m³/s
- 03.08.1987 Abfluss: 42,6 m³/s
- 02.06.1995 Abfluss: 41,4 m³/s
| Date | Mean value [m³/s] | Maximum [m³/s] | Minimum [m³/s] |
|---|---|---|---|
| 07.05.2022 | 0.502 | 0.531 | 0.449 |
| 06.05.2022 | 0.676 | 1 | 0.333 |
| 05.05.2022 | 0.488 | 1 | 0.351 |
| 04.05.2022 | 0.363 | 1.55 | 0.212 |
| 03.05.2022 | 0.249 | 0.288 | 0.212 |
| 02.05.2022 | 0.229 | 0.288 | 0.212 |
| 01.05.2022 | 0.251 | 0.288 | 0.212 |
© Bayerisches Landesamt für Umwelt 2024