

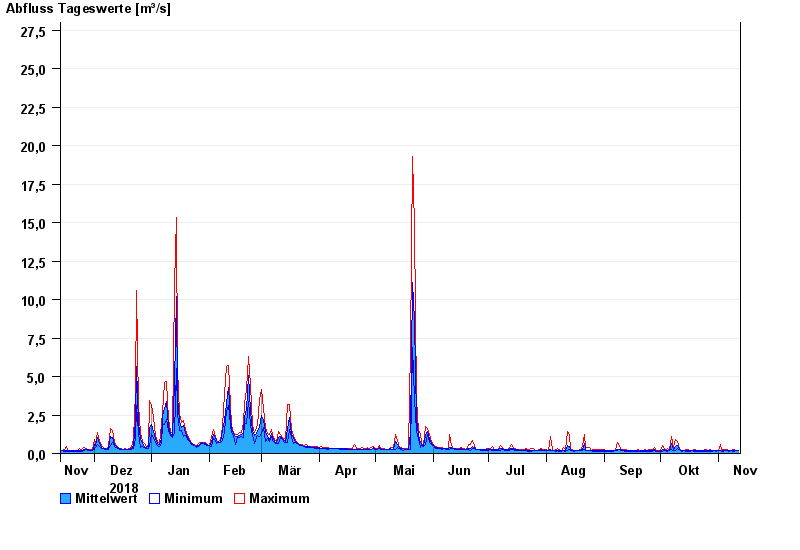
Chart of year Weg / Isen
Discharge from 13.11.2018 to 12.11.2019
- 01.08.1991 Abfluss: 52,8 m³/s
- 04.08.1973 Abfluss: 47,2 m³/s
- 15.02.1990 Abfluss: 45,3 m³/s
- 03.08.1987 Abfluss: 42,6 m³/s
- 02.06.1995 Abfluss: 41,4 m³/s
| Date | Mean value [m³/s] | Maximum [m³/s] | Minimum [m³/s] |
|---|---|---|---|
| 12.11.2019 | 0.192 | 0.213 | 0.167 |
| 11.11.2019 | 0.181 | 0.199 | 0.167 |
| 10.11.2019 | 0.175 | 0.276 | 0.13 |
| 09.11.2019 | 0.184 | 0.243 | 0.13 |
| 08.11.2019 | 0.183 | 0.212 | 0.164 |
| 07.11.2019 | 0.184 | 0.198 | 0.15 |
| 06.11.2019 | 0.196 | 0.228 | 0.177 |
© Bayerisches Landesamt für Umwelt 2024