

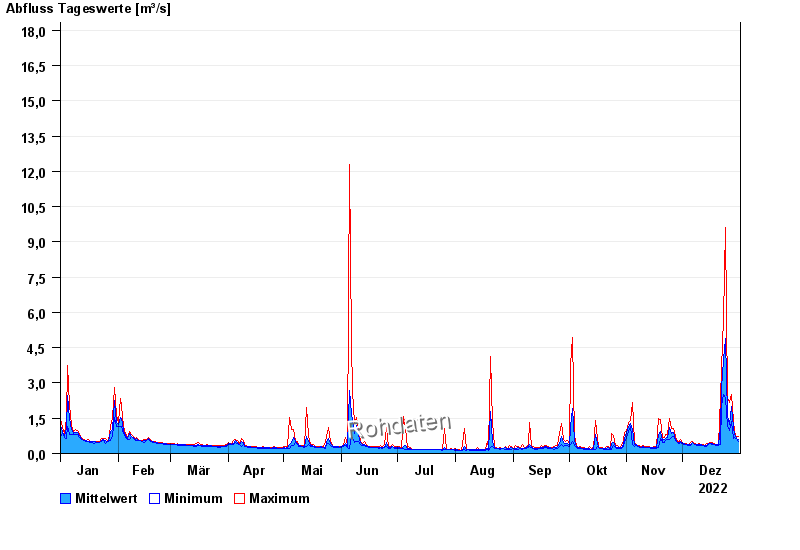
Chart of year Weg / Isen
Discharge from 01.01.2022 to 31.12.2022
- 01.08.1991 Abfluss: 52,8 m³/s
- 04.08.1973 Abfluss: 47,2 m³/s
- 15.02.1990 Abfluss: 45,3 m³/s
- 03.08.1987 Abfluss: 42,6 m³/s
- 02.06.1995 Abfluss: 41,4 m³/s
| Date | Mean value [m³/s] | Maximum [m³/s] | Minimum [m³/s] |
|---|---|---|---|
| 31.12.2022 | 0.582 | 0.74 | 0.514 |
| 30.12.2022 | 0.65 | 0.699 | 0.618 |
| 29.12.2022 | 0.815 | 0.931 | 0.699 |
| 28.12.2022 | 1.12 | 1.42 | 0.658 |
| 27.12.2022 | 2 | 2.52 | 1.37 |
| 26.12.2022 | 1.25 | 2.18 | 0.982 |
| 25.12.2022 | 1.61 | 2.32 | 1.14 |
© Bayerisches Landesamt für Umwelt 2024