

Chart of total period Weg / Isen
Discharge from 01.11.1953 to 26.04.2024
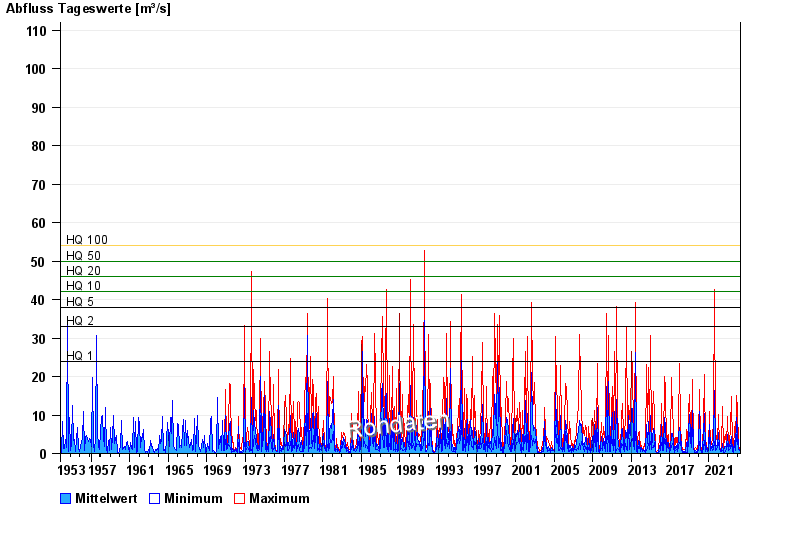
- HQ1 24 m³/s
- HQ2 33 m³/s
- HQ5 38 m³/s
- HQ10 42 m³/s
- HQ20 46 m³/s
- HQ50 50 m³/s
- HQ100 54 m³/s
| Date | Mean value [m³/s] | Maximum [m³/s] | Minimum [m³/s] |
|---|---|---|---|
| 26.04.2024 | 0.473 | 0.503 | 0.471 |
| 25.04.2024 | 0.526 | 0.576 | 0.503 |
| 24.04.2024 | 0.587 | 0.615 | 0.539 |
| 23.04.2024 | 0.647 | 0.742 | 0.576 |
| 22.04.2024 | 0.993 | 1.31 | 0.742 |
| 21.04.2024 | 0.855 | 1.43 | 0.576 |
| 20.04.2024 | 0.506 | 0.615 | 0.441 |
© Bayerisches Landesamt für Umwelt 2024