

Chart of year Walchen / Walchen
Discharge from 29.03.2024 to 28.03.2025
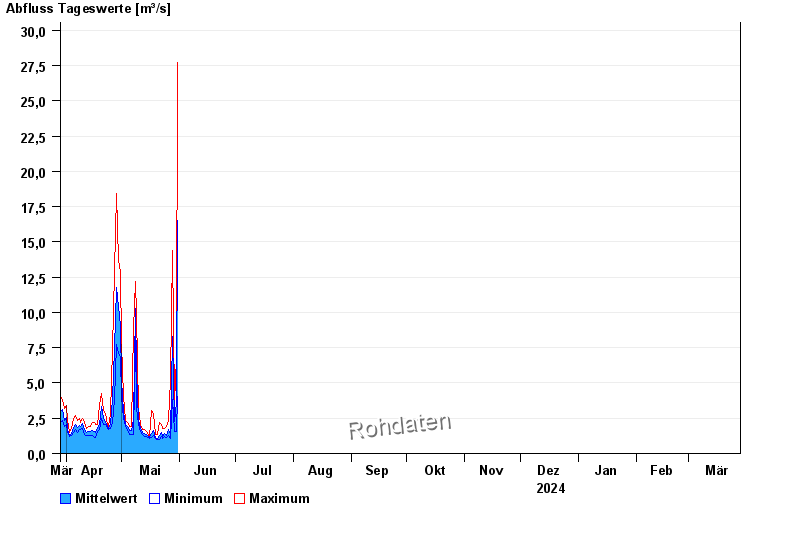
| Date | Mean value [m³/s] | Maximum [m³/s] | Minimum [m³/s] |
|---|---|---|---|
| 16.05.2024 | 1.1 | 1.19 | 1.03 |
| 15.05.2024 | 1.18 | 1.28 | 1.11 |
| 14.05.2024 | 1.35 | 1.57 | 1.19 |
| 13.05.2024 | 1.4 | 1.68 | 1.19 |
| 12.05.2024 | 1.48 | 1.68 | 1.37 |
| 11.05.2024 | 1.75 | 2.06 | 1.57 |
| 10.05.2024 | 2.38 | 3.21 | 2.06 |
© Bayerisches Landesamt für Umwelt 2024