

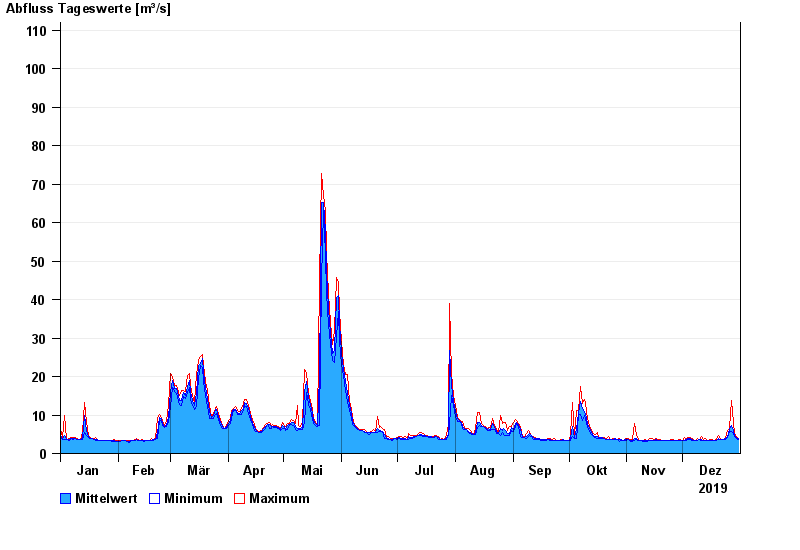
Chart of year Valley / Mangfall
Discharge from 01.01.2019 to 31.12.2019
- 02.06.2013 Abfluss: 157 m³/s
- 23.08.2005 Abfluss: 142 m³/s
- 09.07.1954 Abfluss: 135 m³/s
- 22.05.1999 Abfluss: 125 m³/s
- 23.07.1966 Abfluss: 114 m³/s
| Date | Mean value [m³/s] | Maximum [m³/s] | Minimum [m³/s] |
|---|---|---|---|
| 31.12.2019 | 3.81 | 3.89 | 3.69 |
| 30.12.2019 | 4.05 | 4.32 | 3.89 |
| 29.12.2019 | 4.7 | 5.25 | 4.32 |
| 28.12.2019 | 6.04 | 8.02 | 5.25 |
| 27.12.2019 | 7.17 | 13.8 | 5.76 |
| 26.12.2019 | 6.16 | 6.56 | 5.76 |
| 25.12.2019 | 4.47 | 6.02 | 4.11 |
© Bayerisches Landesamt für Umwelt 2024