

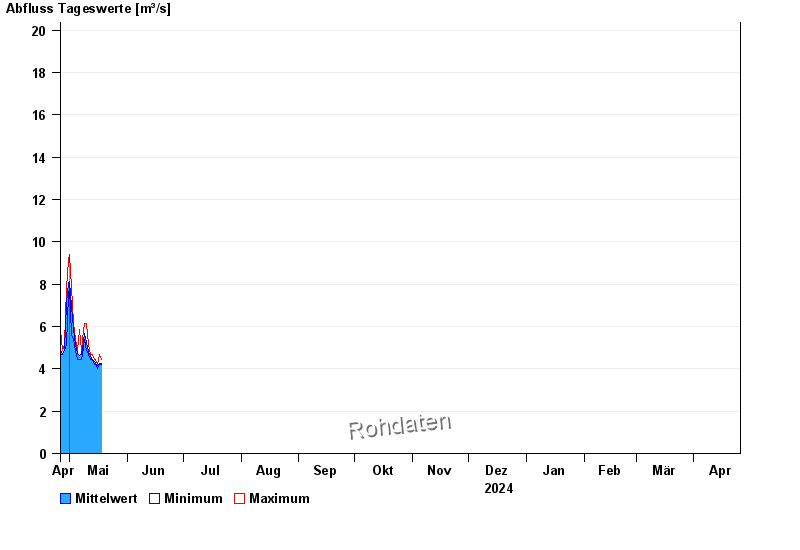
Chart of year Valley / Mangfall
Discharge from 26.04.2024 to 25.04.2025
- HQ1 56 m³/s
- HQ2 66 m³/s
- HQ5 82 m³/s
- HQ10 98 m³/s
- HQ20 115 m³/s
- HQ50 140 m³/s
- HQ100 170 m³/s
| Date | Mean value [m³/s] | Maximum [m³/s] | Minimum [m³/s] |
|---|---|---|---|
| 05.05.2024 | 4.89 | 4.89 | 4.89 |
| 04.05.2024 | 5.08 | 5.37 | 4.89 |
| 03.05.2024 | 5.91 | 6.14 | 5.37 |
| 02.05.2024 | 6.93 | 7.83 | 5.62 |
| 01.05.2024 | 8.14 | 9.41 | 7.83 |
| 30.04.2024 | 8.1 | 9.12 | 7.53 |
| 29.04.2024 | 7.07 | 7.83 | 5.13 |
© Bayerisches Landesamt für Umwelt 2024