

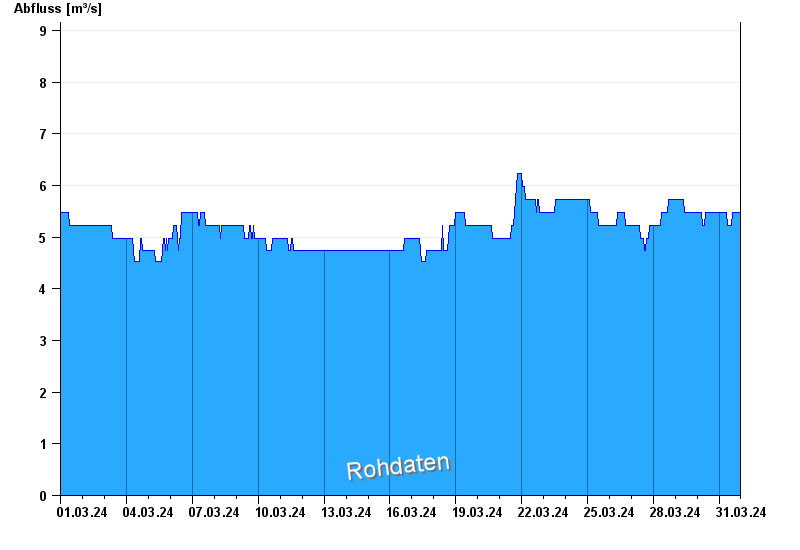
Chart of month Valley / Mangfall
Discharge from 01.03.2024 to 31.03.2024
- 02.06.2013 Abfluss: 157 m³/s
- 23.08.2005 Abfluss: 142 m³/s
- 09.07.1954 Abfluss: 135 m³/s
- 22.05.1999 Abfluss: 125 m³/s
- 23.07.1966 Abfluss: 114 m³/s
| Date | Runoff [m³/s] |
|---|---|
| 01.04.2024 00:45 | 5.47 |
| 01.04.2024 00:30 | 5.47 |
| 01.04.2024 00:15 | 5.47 |
| 01.04.2024 00:00 | 5.47 |
| 31.03.2024 23:45 | 5.47 |
| 31.03.2024 23:30 | 5.47 |
| 31.03.2024 23:15 | 5.47 |
© Bayerisches Landesamt für Umwelt 2024