

Chart of year Triftern / Altbach
Discharge from 01.01.2020 to 31.12.2020
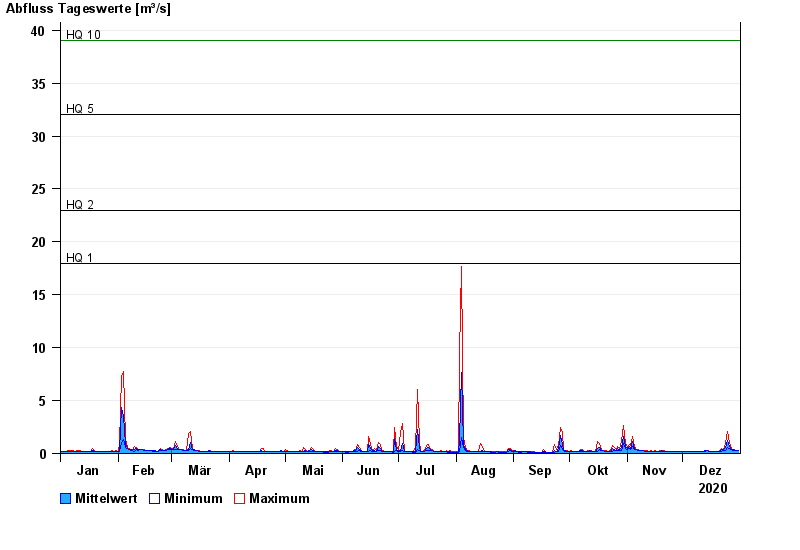
- HQ1 18 m³/s
- HQ2 23 m³/s
- HQ5 32 m³/s
- HQ10 39 m³/s
- HQ20 47 m³/s
- HQ50 60 m³/s
- HQ100 70 m³/s
| Date | Mean value [m³/s] | Maximum [m³/s] | Minimum [m³/s] |
|---|---|---|---|
| 31.12.2020 | 0.267 | 0.294 | 0.264 |
| 30.12.2020 | 0.298 | 0.324 | 0.263 |
| 29.12.2020 | 0.33 | 0.357 | 0.322 |
| 28.12.2020 | 0.35 | 0.388 | 0.321 |
| 27.12.2020 | 0.416 | 0.502 | 0.387 |
| 26.12.2020 | 0.669 | 0.997 | 0.501 |
| 25.12.2020 | 1.23 | 2.08 | 0.582 |
© Bayerisches Landesamt für Umwelt 2024