

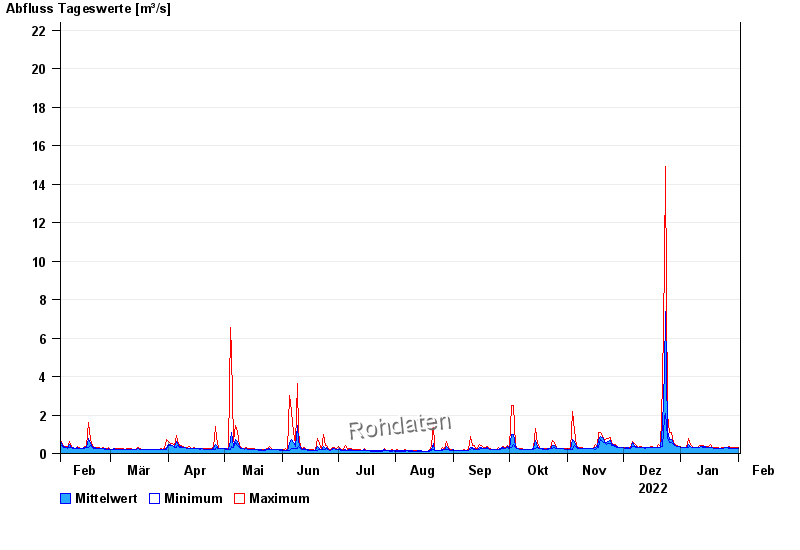
Chart of year Triftern / Altbach
Discharge from 02.02.2022 to 01.02.2023
- 01.08.1991 Abfluss: 67,9 m³/s
- 01.07.1987 Abfluss: 55,8 m³/s
- 01.08.1991 Abfluss: 45,5 m³/s
- 12.06.1990 Abfluss: 44,2 m³/s
- 10.07.1999 Abfluss: 37,8 m³/s
| Date | Mean value [m³/s] | Maximum [m³/s] | Minimum [m³/s] |
|---|---|---|---|
| 01.02.2023 | 0.263 | 0.292 | 0.262 |
| 31.01.2023 | 0.262 | 0.292 | 0.262 |
| 30.01.2023 | 0.264 | 0.292 | 0.262 |
| 29.01.2023 | 0.263 | 0.292 | 0.262 |
| 28.01.2023 | 0.27 | 0.323 | 0.262 |
| 27.01.2023 | 0.289 | 0.357 | 0.262 |
| 26.01.2023 | 0.292 | 0.292 | 0.292 |
© Bayerisches Landesamt für Umwelt 2024