

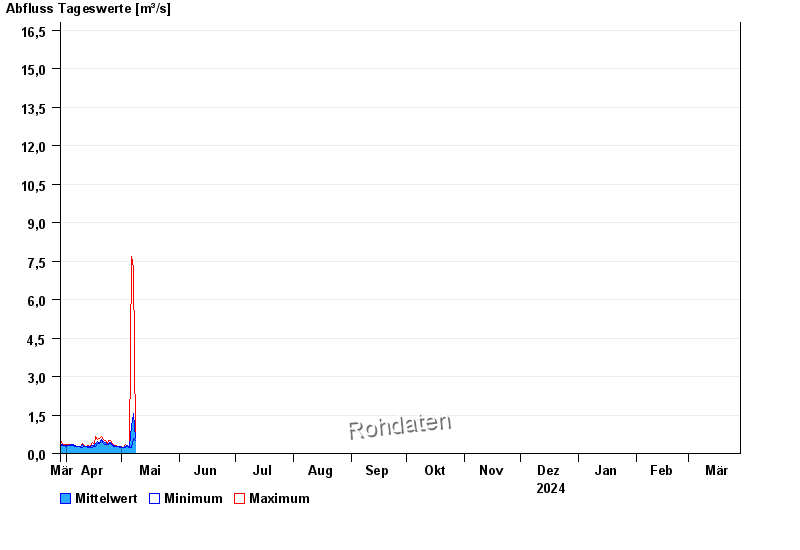
Chart of year Triftern / Altbach
Discharge from 29.03.2024 to 28.03.2025
- HQ1 18 m³/s
- HQ2 23 m³/s
- HQ5 32 m³/s
- HQ10 39 m³/s
- HQ20 47 m³/s
- HQ50 60 m³/s
- HQ100 70 m³/s
| Date | Mean value [m³/s] | Maximum [m³/s] | Minimum [m³/s] |
|---|---|---|---|
| 09.05.2024 | 0.508 | 0.546 | 0.448 |
| 08.05.2024 | 0.596 | 0.708 | 0.496 |
| 07.05.2024 | 1.57 | 7.21 | 0.599 |
| 06.05.2024 | 1.06 | 7.69 | 0.241 |
| 05.05.2024 | 0.268 | 0.277 | 0.241 |
| 04.05.2024 | 0.302 | 0.317 | 0.277 |
| 03.05.2024 | 0.274 | 0.358 | 0.241 |
© Bayerisches Landesamt für Umwelt 2024