
- Start >
- Rivers >
- Discharge >
- Inn >
- Staufeneck >
- Chart of year

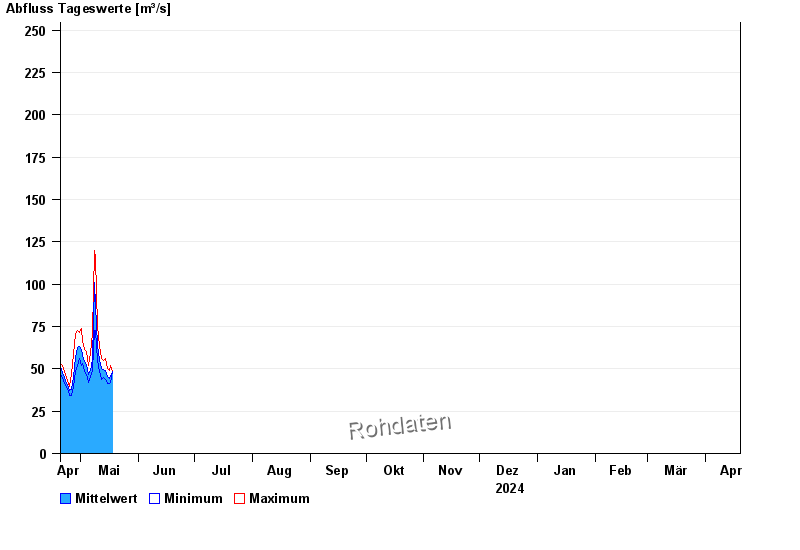
Chart of year Staufeneck / Saalach
Discharge from 20.04.2024 to 19.04.2025
- HQ5 520 m³/s
- HQ10 610 m³/s
- HQ20 700 m³/s
- HQ50 860 m³/s
- HQ100 975 m³/s
| Date | Mean value [m³/s] | Maximum [m³/s] | Minimum [m³/s] |
|---|---|---|---|
| 17.05.2024 | 45.3 | 52.2 | 42.1 |
| 16.05.2024 | 44.2 | 49.3 | 41.3 |
| 15.05.2024 | 45.7 | 50.3 | 41.3 |
| 14.05.2024 | 48.8 | 56.2 | 43.8 |
| 13.05.2024 | 49.7 | 55.2 | 44.7 |
| 12.05.2024 | 50.3 | 56.2 | 43.8 |
| 11.05.2024 | 55.3 | 63.6 | 48.3 |
© Bayerisches Landesamt für Umwelt 2024