

Chart of year Staudach / Tiroler Achen
Discharge from 29.09.2020 to 28.09.2021
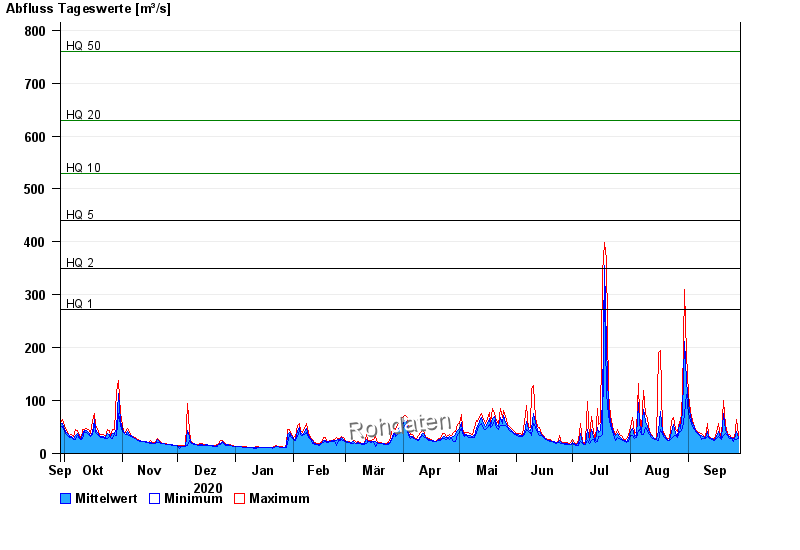
- HQ1 272 m³/s
- HQ2 350 m³/s
- HQ5 440 m³/s
- HQ10 530 m³/s
- HQ20 630 m³/s
- HQ50 760 m³/s
- HQ100 870 m³/s
| Date | Mean value [m³/s] | Maximum [m³/s] | Minimum [m³/s] |
|---|---|---|---|
| 28.09.2021 | 30.8 | 34 | 29 |
| 27.09.2021 | 41.7 | 64.3 | 26.3 |
| 26.09.2021 | 26.6 | 27 | 26.3 |
| 25.09.2021 | 27.8 | 30.4 | 22.4 |
| 24.09.2021 | 29.4 | 30.4 | 28.3 |
| 23.09.2021 | 31.9 | 35.6 | 28.3 |
| 22.09.2021 | 35.1 | 37.8 | 33.3 |
© Bayerisches Landesamt für Umwelt 2024