

Chart of year Staudach / Tiroler Achen
Discharge from 30.03.2024 to 29.03.2025
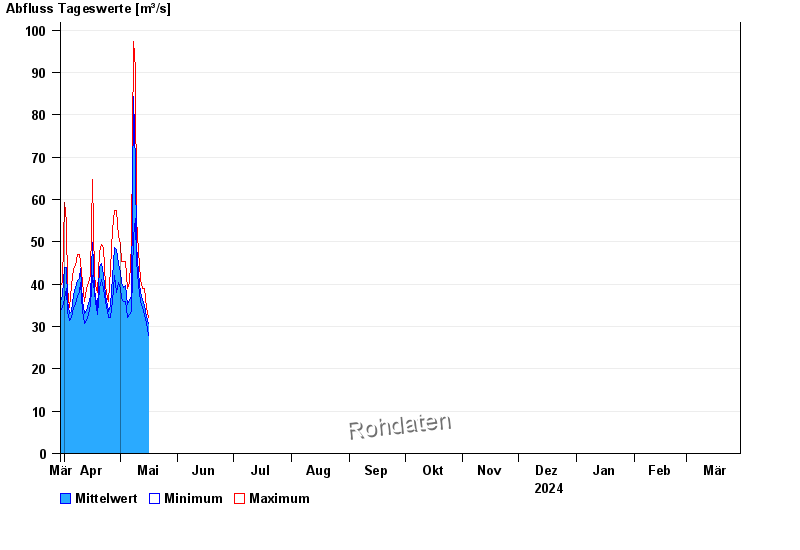
| Date | Mean value [m³/s] | Maximum [m³/s] | Minimum [m³/s] |
|---|---|---|---|
| 10.05.2024 | 55.5 | 55.5 | 55.5 |
| 09.05.2024 | 68.1 | 90.8 | 55.5 |
| 08.05.2024 | 84.4 | 97.4 | 51.2 |
| 07.05.2024 | 37 | 49.4 | 33.6 |
| 06.05.2024 | 36.1 | 40.5 | 32.9 |
| 05.05.2024 | 35.2 | 38.9 | 32.2 |
| 04.05.2024 | 39.7 | 45.3 | 35.9 |
© Bayerisches Landesamt für Umwelt 2024