

Chart of year Simbach / Simbach
Discharge from 01.11.2021 to 31.10.2022
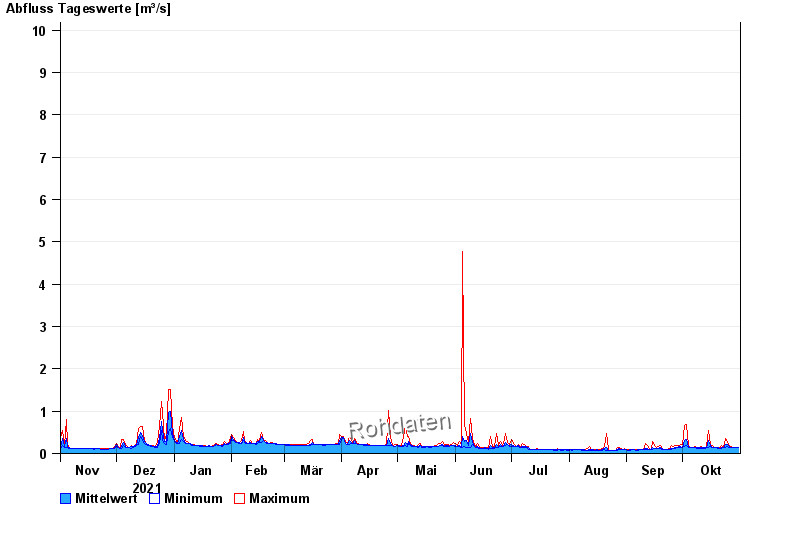 Für diesen Pegel sind keine Jährlichkeiten hinterlegt.
| Date | Mean value [m³/s] | Maximum [m³/s] | Minimum [m³/s] |
|---|---|---|---|
| 31.10.2022 | 0.139 | 0.139 | 0.139 |
| 30.10.2022 | 0.139 | 0.139 | 0.139 |
| 29.10.2022 | 0.139 | 0.139 | 0.139 |
| 28.10.2022 | 0.139 | 0.139 | 0.139 |
| 27.10.2022 | 0.139 | 0.16 | 0.139 |
| 26.10.2022 | 0.159 | 0.16 | 0.139 |
| 25.10.2022 | 0.201 | 0.291 | 0.16 |
© Bayerisches Landesamt für Umwelt 2024