

Chart of year Simbach / Simbach
Discharge from 01.11.2019 to 31.10.2020
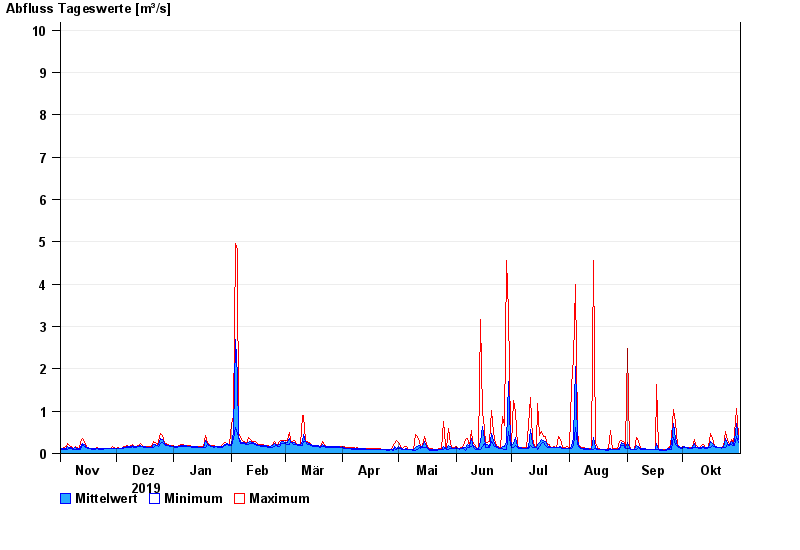 Für diesen Pegel sind keine Jährlichkeiten hinterlegt.
| Date | Mean value [m³/s] | Maximum [m³/s] | Minimum [m³/s] |
|---|---|---|---|
| 31.10.2020 | 0.332 | 0.438 | 0.27 |
| 30.10.2020 | 0.716 | 1.06 | 0.4 |
| 29.10.2020 | 0.311 | 0.477 | 0.191 |
| 28.10.2020 | 0.203 | 0.241 | 0.191 |
| 27.10.2020 | 0.274 | 0.33 | 0.215 |
| 26.10.2020 | 0.197 | 0.215 | 0.191 |
| 25.10.2020 | 0.232 | 0.298 | 0.215 |
© Bayerisches Landesamt für Umwelt 2024