

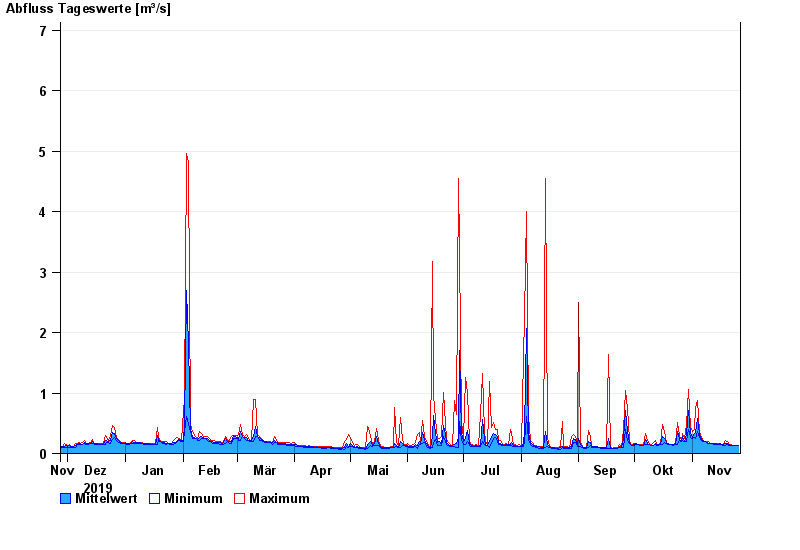
Chart of year Simbach / Simbach
Discharge from 27.11.2019 to 26.11.2020
- 10.07.1999 Abfluss: 50,1 m³/s
- 01.08.1991 Abfluss: 24,7 m³/s
- 10.06.2007 Abfluss: 24,5 m³/s
- 02.03.1987 Abfluss: 24,3 m³/s
- 02.08.1991 Abfluss: 23,8 m³/s
| Date | Mean value [m³/s] | Maximum [m³/s] | Minimum [m³/s] |
|---|---|---|---|
| 26.11.2020 | 0.132 | 0.132 | 0.132 |
| 25.11.2020 | 0.132 | 0.132 | 0.132 |
| 24.11.2020 | 0.132 | 0.132 | 0.132 |
| 23.11.2020 | 0.132 | 0.132 | 0.132 |
| 22.11.2020 | 0.134 | 0.151 | 0.131 |
| 21.11.2020 | 0.151 | 0.151 | 0.131 |
| 20.11.2020 | 0.168 | 0.195 | 0.151 |
© Bayerisches Landesamt für Umwelt 2024