

Chart of total period Seebruck / Alz
Discharge from 01.11.1930 to 08.05.2024
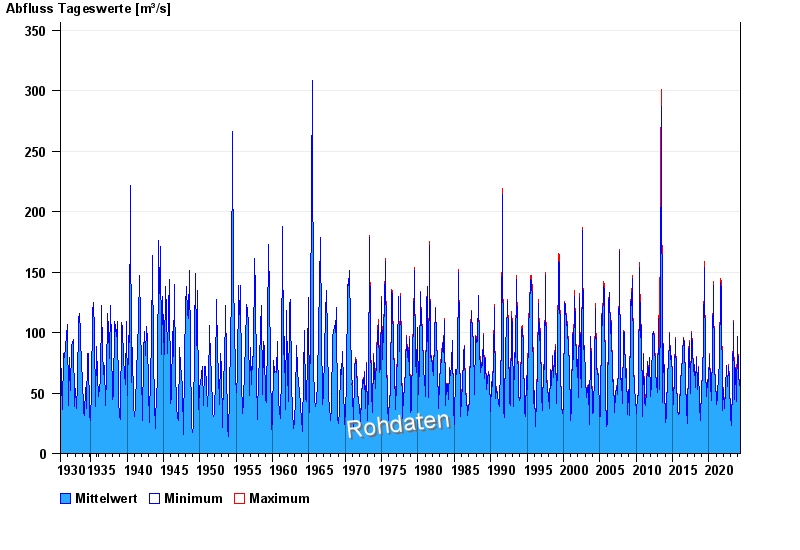
| Date | Mean value [m³/s] | Maximum [m³/s] | Minimum [m³/s] |
|---|---|---|---|
| 08.05.2024 | 55.1 | 57 | 53.2 |
| 07.05.2024 | 53.7 | 54.1 | 53.2 |
| 06.05.2024 | 54.4 | 55.1 | 54.1 |
| 05.05.2024 | 55.2 | 56 | 54.1 |
| 04.05.2024 | 56 | 56 | 56 |
| 03.05.2024 | 55.9 | 56 | 55.1 |
| 02.05.2024 | 56 | 56 | 56 |
© Bayerisches Landesamt für Umwelt 2024