

Chart of year Ruhstorf / Rott
Discharge from 01.01.2024 to 02.05.2024
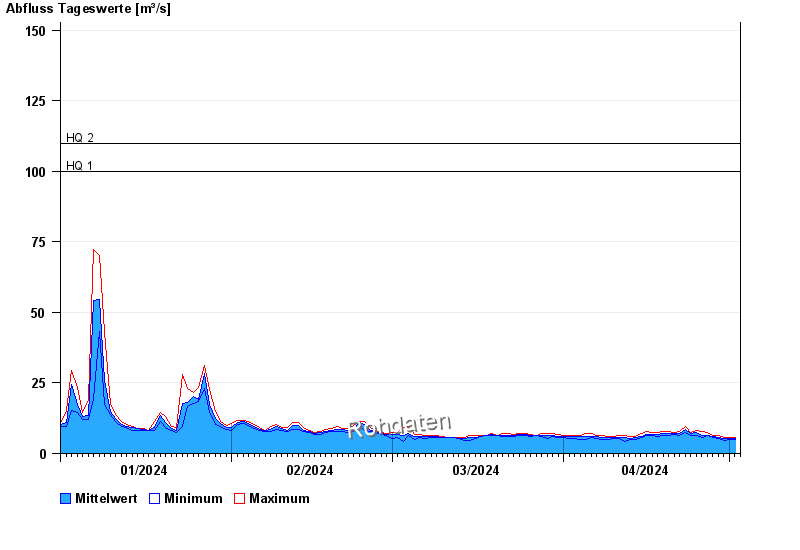
- HQ1 100 m³/s
- HQ2 110 m³/s
- HQ5 160 m³/s
- HQ10 200 m³/s
- HQ20 250 m³/s
- HQ50 337 m³/s
- HQ100 480 m³/s
| Date | Mean value [m³/s] | Maximum [m³/s] | Minimum [m³/s] |
|---|---|---|---|
| 02.05.2024 | 5.35 | 5.74 | 4.79 |
| 01.05.2024 | 5.22 | 5.74 | 4.79 |
| 30.04.2024 | 5.32 | 5.74 | 4.57 |
| 29.04.2024 | 5.73 | 6.23 | 5.26 |
| 28.04.2024 | 6.06 | 6.48 | 5.74 |
| 27.04.2024 | 6.43 | 7.53 | 6.23 |
| 26.04.2024 | 6.51 | 7.79 | 5.74 |
© Bayerisches Landesamt für Umwelt 2024