
- Start >
- Rivers >
- Discharge >
- Inn >
- Rottersdorf >
- Chart of year

Chart of year Rottersdorf / Vils
Discharge from 20.08.2019 to 19.08.2020
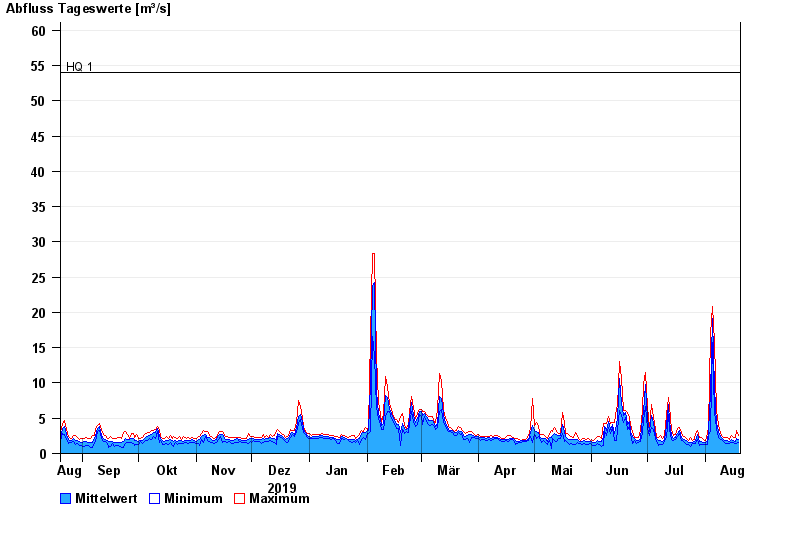
- HQ1 54 m³/s
- HQ2 67 m³/s
- HQ5 85 m³/s
- HQ10 98 m³/s
- HQ20 110 m³/s
| Date | Mean value [m³/s] | Maximum [m³/s] | Minimum [m³/s] |
|---|---|---|---|
| 19.08.2020 | 1.92 | 2.56 | 1.51 |
| 18.08.2020 | 2.16 | 3.23 | 1.43 |
| 17.08.2020 | 1.72 | 2.23 | 1.36 |
| 16.08.2020 | 1.79 | 2.22 | 1.51 |
| 15.08.2020 | 2.01 | 2.56 | 1.58 |
| 14.08.2020 | 1.76 | 2.02 | 1.43 |
| 13.08.2020 | 1.86 | 2.33 | 1.43 |
© Bayerisches Landesamt für Umwelt 2024