
- Start >
- Rivers >
- Discharge >
- Inn >
- Rottersdorf >
- Chart of year

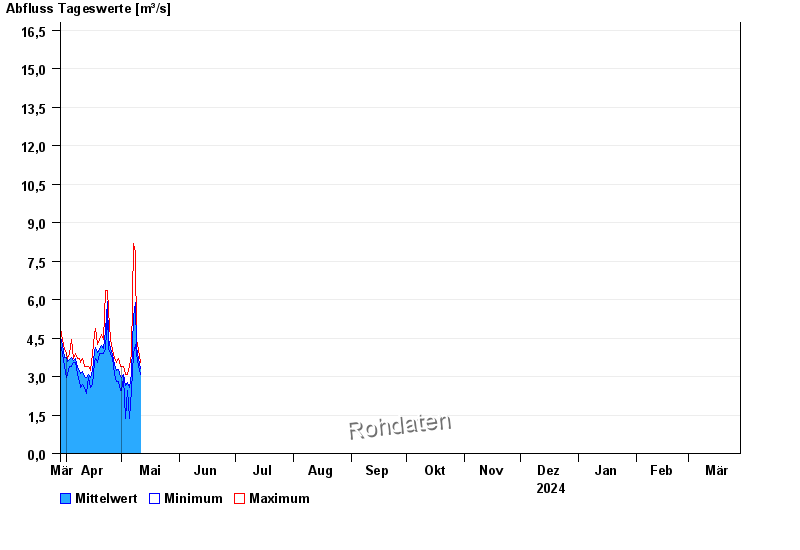
Chart of year Rottersdorf / Vils
Discharge from 29.03.2024 to 28.03.2025
- HQ1 54 m³/s
- HQ2 67 m³/s
- HQ5 85 m³/s
- HQ10 98 m³/s
- HQ20 110 m³/s
| Date | Mean value [m³/s] | Maximum [m³/s] | Minimum [m³/s] |
|---|---|---|---|
| 13.05.2024 | 2.92 | 3.23 | 2.7 |
| 12.05.2024 | 2.95 | 3.23 | 2.7 |
| 11.05.2024 | 3.22 | 3.54 | 2.82 |
| 10.05.2024 | 3.69 | 4.06 | 3.38 |
| 09.05.2024 | 4.14 | 4.45 | 3.88 |
| 08.05.2024 | 5.89 | 7.84 | 4.25 |
| 07.05.2024 | 5.35 | 8.17 | 3.88 |
© Bayerisches Landesamt für Umwelt 2024