

Chart of year Piding / Stoißer Ache
Discharge from 24.08.2022 to 23.08.2023
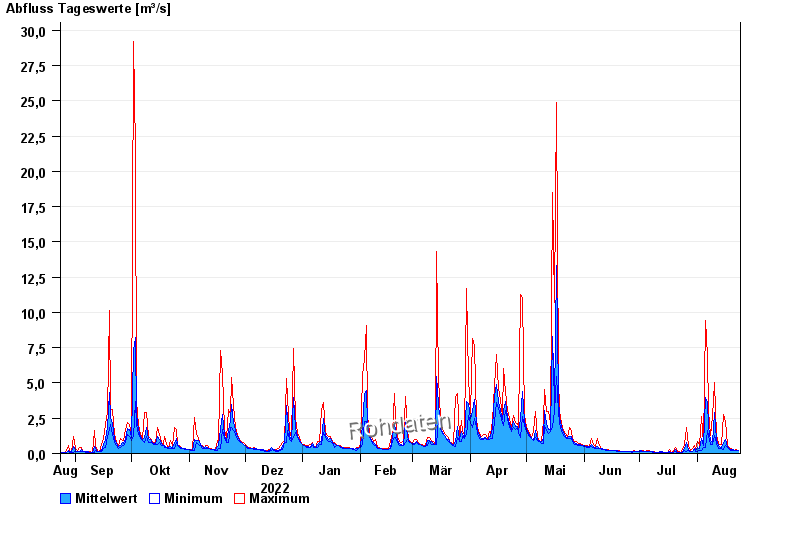
| Date | Mean value [m³/s] | Maximum [m³/s] | Minimum [m³/s] |
|---|---|---|---|
| 23.08.2023 | 0.214 | 0.238 | 0.198 |
| 22.08.2023 | 0.234 | 0.284 | 0.198 |
| 21.08.2023 | 0.238 | 0.238 | 0.238 |
| 20.08.2023 | 0.262 | 0.284 | 0.238 |
| 19.08.2023 | 0.285 | 0.34 | 0.238 |
| 18.08.2023 | 0.347 | 0.402 | 0.284 |
| 17.08.2023 | 0.467 | 0.547 | 0.402 |
© Bayerisches Landesamt für Umwelt 2024