

Chart of year Piding / Stoißer Ache
Discharge from 24.08.2021 to 23.08.2022
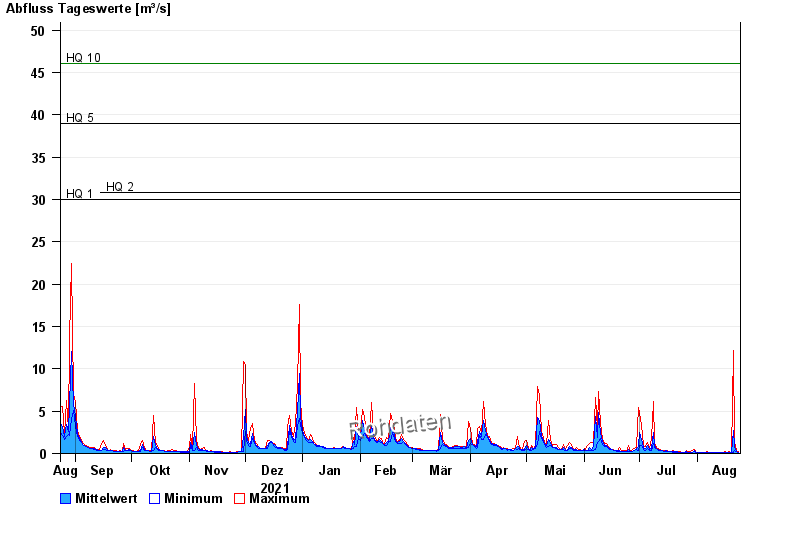
- HQ1 30 m³/s
- HQ2 30,8 m³/s
- HQ5 39 m³/s
- HQ10 46,1 m³/s
- HQ20 53,8 m³/s
- HQ50 66 m³/s
- HQ100 76,5 m³/s
| Date | Mean value [m³/s] | Maximum [m³/s] | Minimum [m³/s] |
|---|---|---|---|
| 23.08.2022 | 0.148 | 0.197 | 0.128 |
| 22.08.2022 | 0.244 | 0.368 | 0.197 |
| 21.08.2022 | 0.776 | 1.31 | 0.368 |
| 20.08.2022 | 2.74 | 12.2 | 0.081 |
| 19.08.2022 | 0.087 | 0.128 | 0.081 |
| 18.08.2022 | 0.094 | 0.244 | 0.064 |
| 17.08.2022 | 0.073 | 0.102 | 0.064 |
© Bayerisches Landesamt für Umwelt 2024