

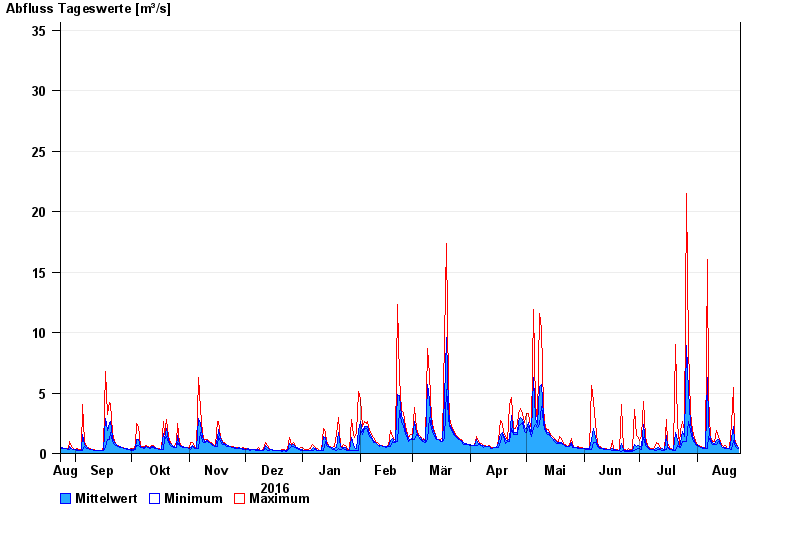
Chart of year Piding / Stoißer Ache
Discharge from 24.08.2016 to 23.08.2017
- 12.08.2002 Abfluss: 103 m³/s
- 08.07.1954 Abfluss: 86 m³/s
- 04.08.2020 Abfluss: 77,7 m³/s
- 26.06.1995 Abfluss: 77,6 m³/s
- 03.07.2009 Abfluss: 72,4 m³/s
| Date | Mean value [m³/s] | Maximum [m³/s] | Minimum [m³/s] |
|---|---|---|---|
| 23.08.2017 | 0.513 | 0.522 | 0.44 |
| 22.08.2017 | 0.648 | 0.714 | 0.522 |
| 21.08.2017 | 0.992 | 1.23 | 0.714 |
| 20.08.2017 | 2.2 | 5.45 | 1.09 |
| 19.08.2017 | 1.21 | 2.36 | 0.311 |
| 18.08.2017 | 0.38 | 0.451 | 0.377 |
| 17.08.2017 | 0.434 | 0.454 | 0.379 |
© Bayerisches Landesamt für Umwelt 2024