

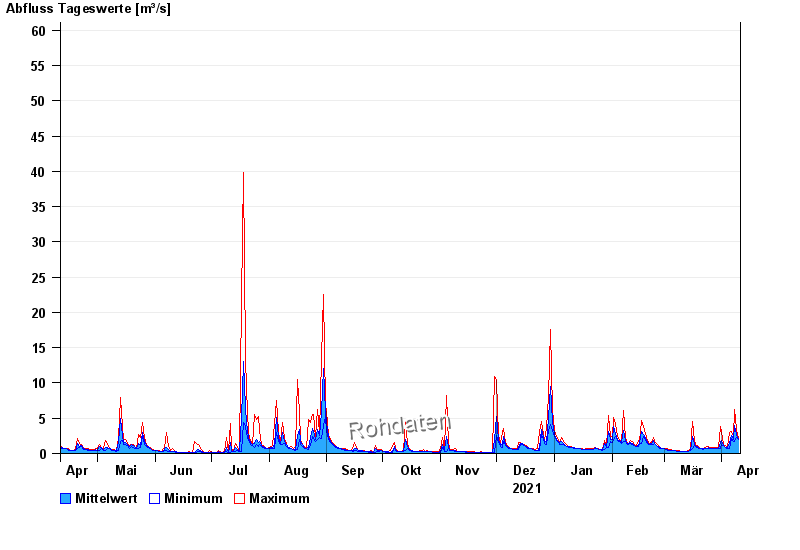
Chart of year Piding / Stoißer Ache
Discharge from 11.04.2021 to 10.04.2022
- 12.08.2002 Abfluss: 103 m³/s
- 08.07.1954 Abfluss: 86 m³/s
- 04.08.2020 Abfluss: 77,7 m³/s
- 26.06.1995 Abfluss: 77,6 m³/s
- 03.07.2009 Abfluss: 72,4 m³/s
| Date | Mean value [m³/s] | Maximum [m³/s] | Minimum [m³/s] |
|---|---|---|---|
| 10.04.2022 | 1.97 | 2.11 | 1.95 |
| 09.04.2022 | 2.76 | 3.37 | 2.28 |
| 08.04.2022 | 3.9 | 6.19 | 1.64 |
| 07.04.2022 | 1.98 | 2.45 | 1.64 |
| 06.04.2022 | 2.55 | 3.18 | 2.11 |
| 05.04.2022 | 1.44 | 2.99 | 0.745 |
| 04.04.2022 | 0.826 | 0.971 | 0.643 |
© Bayerisches Landesamt für Umwelt 2024