

Chart of year Piding / Stoißer Ache
Discharge from 11.04.2020 to 10.04.2021
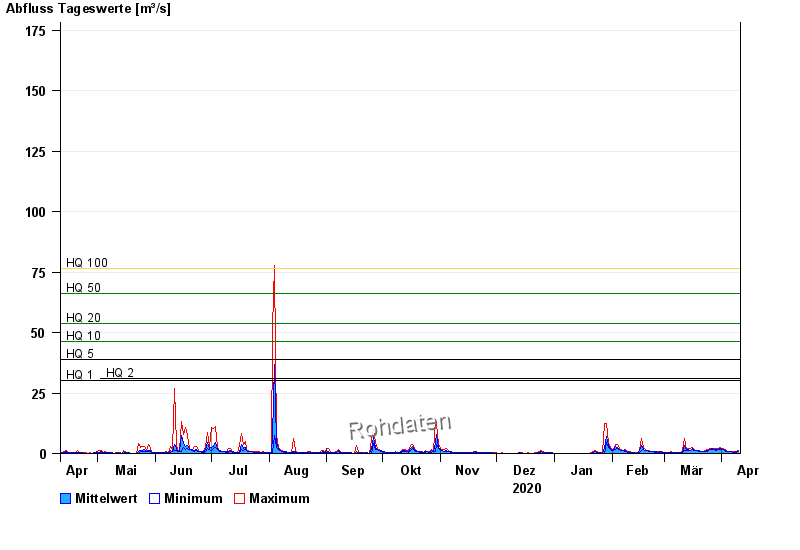
- HQ1 30 m³/s
- HQ2 30,8 m³/s
- HQ5 39 m³/s
- HQ10 46,1 m³/s
- HQ20 53,8 m³/s
- HQ50 66 m³/s
- HQ100 76,5 m³/s
| Date | Mean value [m³/s] | Maximum [m³/s] | Minimum [m³/s] |
|---|---|---|---|
| 10.04.2021 | 0.874 | 1.18 | 0.642 |
| 09.04.2021 | 0.627 | 0.905 | 0.529 |
| 08.04.2021 | 0.554 | 0.642 | 0.529 |
| 07.04.2021 | 0.616 | 0.642 | 0.529 |
| 06.04.2021 | 0.708 | 0.905 | 0.642 |
| 05.04.2021 | 0.668 | 0.905 | 0.642 |
| 04.04.2021 | 0.835 | 0.905 | 0.774 |
© Bayerisches Landesamt für Umwelt 2024