

Chart of year Piding / Stoißer Ache
Discharge from 22.09.2020 to 21.09.2021
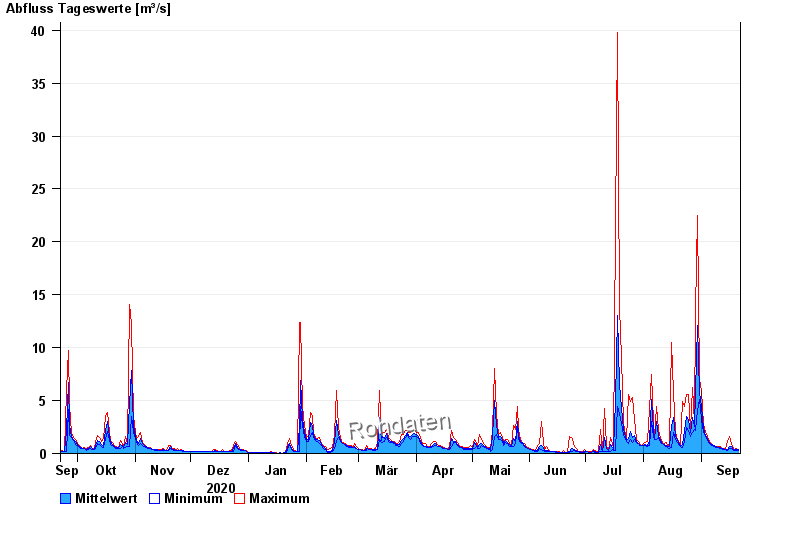
| Date | Mean value [m³/s] | Maximum [m³/s] | Minimum [m³/s] |
|---|---|---|---|
| 21.09.2021 | 0.336 | 0.377 | 0.307 |
| 20.09.2021 | 0.41 | 0.462 | 0.307 |
| 19.09.2021 | 0.364 | 0.377 | 0.307 |
| 18.09.2021 | 0.422 | 0.462 | 0.307 |
| 17.09.2021 | 0.679 | 0.893 | 0.462 |
| 16.09.2021 | 0.694 | 1.56 | 0.462 |
| 15.09.2021 | 0.412 | 1.14 | 0.307 |
© Bayerisches Landesamt für Umwelt 2024