

Chart of year Piding / Stoißer Ache
Discharge from 18.11.2019 to 17.11.2020
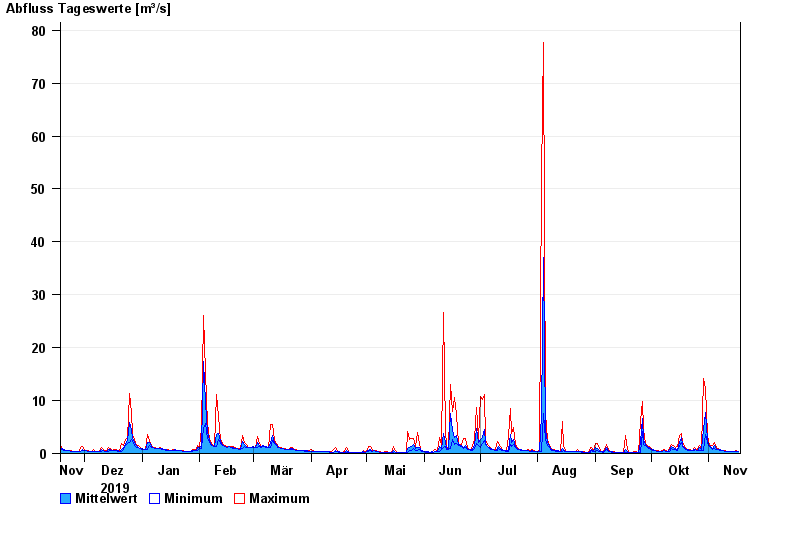
| Date | Mean value [m³/s] | Maximum [m³/s] | Minimum [m³/s] |
|---|---|---|---|
| 17.11.2020 | 0.308 | 0.361 | 0.303 |
| 16.11.2020 | 0.371 | 0.502 | 0.302 |
| 15.11.2020 | 0.302 | 0.358 | 0.301 |
| 14.11.2020 | 0.32 | 0.357 | 0.3 |
| 13.11.2020 | 0.362 | 0.421 | 0.3 |
| 12.11.2020 | 0.4 | 0.42 | 0.299 |
| 11.11.2020 | 0.418 | 0.419 | 0.418 |
© Bayerisches Landesamt für Umwelt 2024