

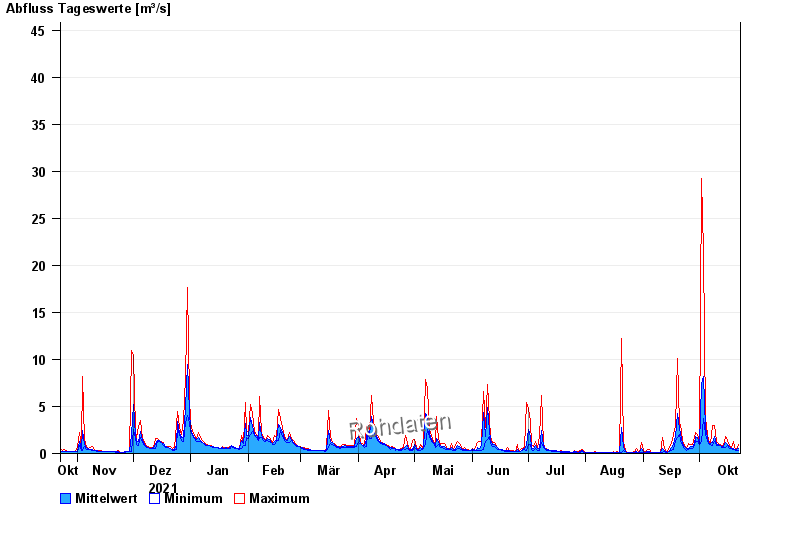
Chart of year Piding / Stoißer Ache
Discharge from 23.10.2021 to 22.10.2022
- 12.08.2002 Abfluss: 103 m³/s
- 08.07.1954 Abfluss: 86 m³/s
- 04.08.2020 Abfluss: 77,7 m³/s
- 26.06.1995 Abfluss: 77,6 m³/s
- 03.07.2009 Abfluss: 72,4 m³/s
| Date | Mean value [m³/s] | Maximum [m³/s] | Minimum [m³/s] |
|---|---|---|---|
| 22.10.2022 | 0.503 | 0.943 | 0.372 |
| 21.10.2022 | 0.436 | 0.454 | 0.372 |
| 20.10.2022 | 0.46 | 0.671 | 0.454 |
| 19.10.2022 | 0.554 | 1.23 | 0.454 |
| 18.10.2022 | 0.558 | 0.671 | 0.554 |
| 17.10.2022 | 0.731 | 0.808 | 0.554 |
| 16.10.2022 | 0.999 | 1.38 | 0.808 |
© Bayerisches Landesamt für Umwelt 2024