

Chart of year Piding / Stoißer Ache
Discharge from 21.11.2019 to 20.11.2020
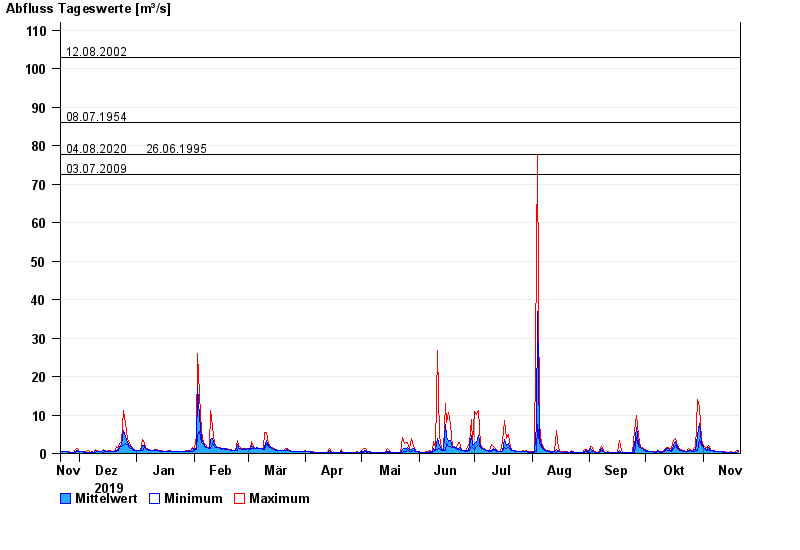
- 12.08.2002 Abfluss: 103 m³/s
- 08.07.1954 Abfluss: 86 m³/s
- 04.08.2020 Abfluss: 77,7 m³/s
- 26.06.1995 Abfluss: 77,6 m³/s
- 03.07.2009 Abfluss: 72,4 m³/s
| Date | Mean value [m³/s] | Maximum [m³/s] | Minimum [m³/s] |
|---|---|---|---|
| 20.11.2020 | 0.626 | 0.791 | 0.508 |
| 19.11.2020 | 0.326 | 0.79 | 0.257 |
| 18.11.2020 | 0.282 | 0.305 | 0.257 |
| 17.11.2020 | 0.308 | 0.361 | 0.303 |
| 16.11.2020 | 0.371 | 0.502 | 0.302 |
| 15.11.2020 | 0.302 | 0.358 | 0.301 |
| 14.11.2020 | 0.32 | 0.357 | 0.3 |
© Bayerisches Landesamt für Umwelt 2024