

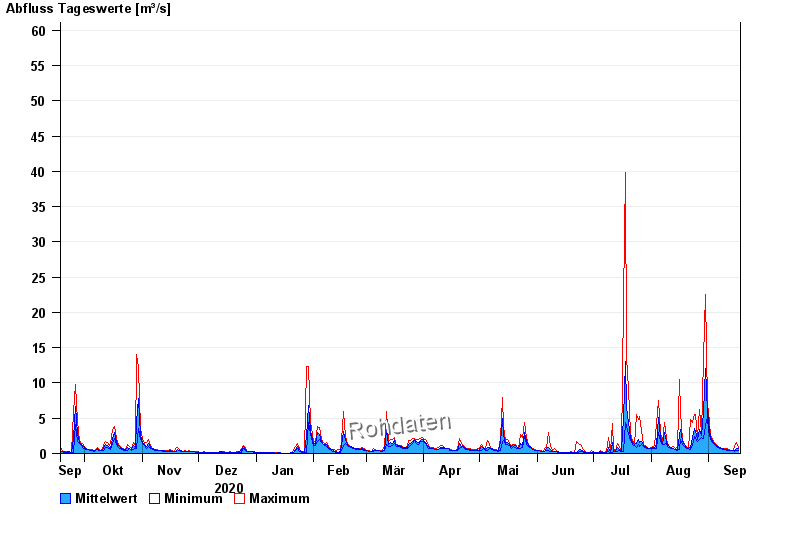
Chart of year Piding / Stoißer Ache
Discharge from 18.09.2020 to 17.09.2021
- 12.08.2002 Abfluss: 103 m³/s
- 08.07.1954 Abfluss: 86 m³/s
- 04.08.2020 Abfluss: 77,7 m³/s
- 26.06.1995 Abfluss: 77,6 m³/s
- 03.07.2009 Abfluss: 72,4 m³/s
| Date | Mean value [m³/s] | Maximum [m³/s] | Minimum [m³/s] |
|---|---|---|---|
| 17.09.2021 | 0.679 | 0.893 | 0.462 |
| 16.09.2021 | 0.694 | 1.56 | 0.462 |
| 15.09.2021 | 0.412 | 1.14 | 0.307 |
| 14.09.2021 | 0.381 | 0.462 | 0.377 |
| 13.09.2021 | 0.442 | 0.462 | 0.377 |
| 12.09.2021 | 0.466 | 0.563 | 0.462 |
| 11.09.2021 | 0.533 | 0.667 | 0.462 |
© Bayerisches Landesamt für Umwelt 2024