

Chart of year Piding / Stoißer Ache
Discharge from 15.11.2019 to 14.11.2020
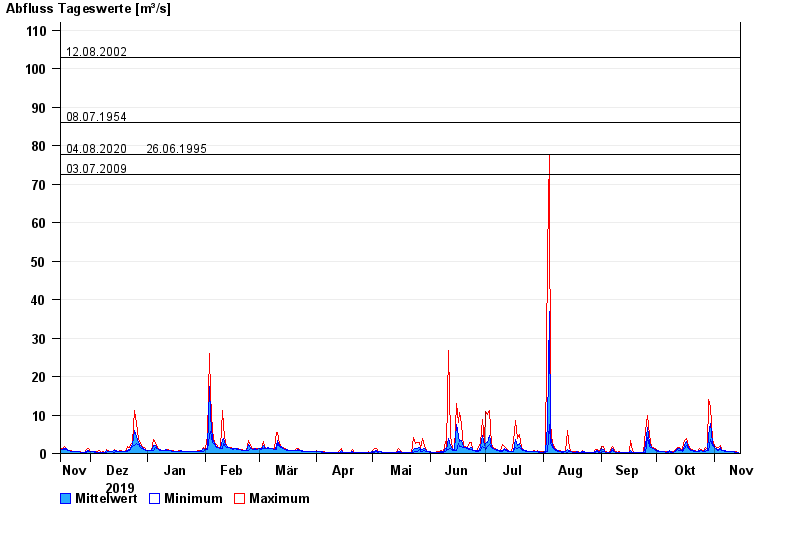
- 12.08.2002 Abfluss: 103 m³/s
- 08.07.1954 Abfluss: 86 m³/s
- 04.08.2020 Abfluss: 77,7 m³/s
- 26.06.1995 Abfluss: 77,6 m³/s
- 03.07.2009 Abfluss: 72,4 m³/s
| Date | Mean value [m³/s] | Maximum [m³/s] | Minimum [m³/s] |
|---|---|---|---|
| 14.11.2020 | 0.32 | 0.357 | 0.3 |
| 13.11.2020 | 0.362 | 0.421 | 0.3 |
| 12.11.2020 | 0.4 | 0.42 | 0.299 |
| 11.11.2020 | 0.418 | 0.419 | 0.418 |
| 10.11.2020 | 0.453 | 0.492 | 0.416 |
| 09.11.2020 | 0.496 | 0.575 | 0.489 |
| 08.11.2020 | 0.57 | 0.574 | 0.489 |
© Bayerisches Landesamt für Umwelt 2024