

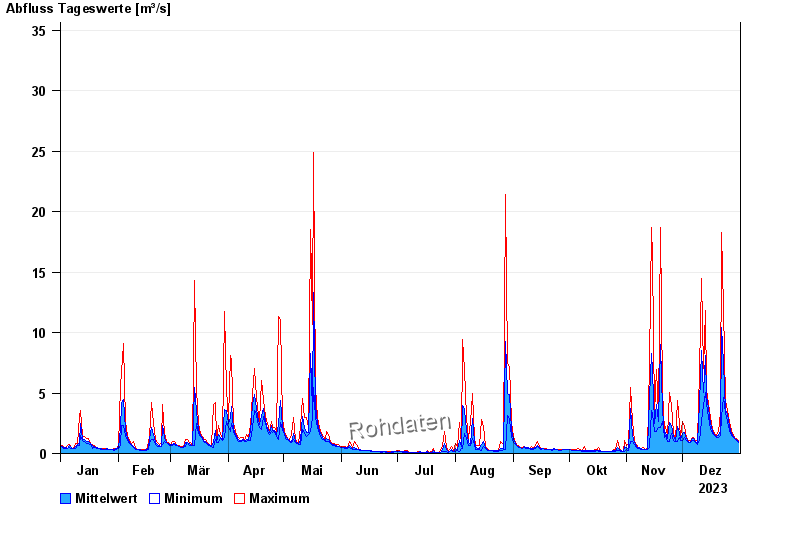
Chart of year Piding / Stoißer Ache
Discharge from 01.01.2023 to 31.12.2023
- 12.08.2002 Abfluss: 103 m³/s
- 08.07.1954 Abfluss: 86 m³/s
- 04.08.2020 Abfluss: 77,7 m³/s
- 26.06.1995 Abfluss: 77,6 m³/s
- 03.07.2009 Abfluss: 72,4 m³/s
| Date | Mean value [m³/s] | Maximum [m³/s] | Minimum [m³/s] |
|---|---|---|---|
| 31.12.2023 | 0.996 | 1.11 | 0.879 |
| 30.12.2023 | 1.13 | 1.23 | 1.11 |
| 29.12.2023 | 1.25 | 1.36 | 1.23 |
| 28.12.2023 | 1.41 | 1.5 | 1.36 |
| 27.12.2023 | 1.68 | 1.94 | 1.5 |
| 26.12.2023 | 2.22 | 2.61 | 1.94 |
| 25.12.2023 | 3.22 | 3.55 | 2.61 |
© Bayerisches Landesamt für Umwelt 2024