

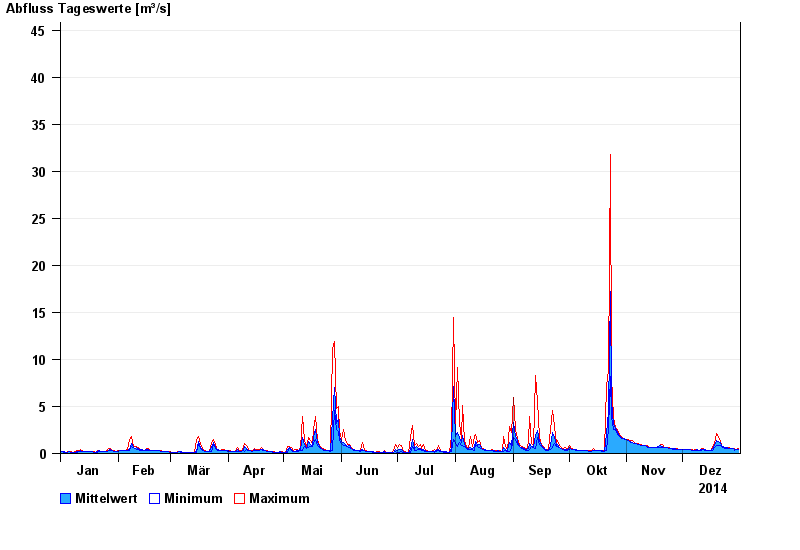
Chart of year Piding / Stoißer Ache
Discharge from 01.01.2014 to 31.12.2014
- 12.08.2002 Abfluss: 103 m³/s
- 08.07.1954 Abfluss: 86 m³/s
- 04.08.2020 Abfluss: 77,7 m³/s
- 26.06.1995 Abfluss: 77,6 m³/s
- 03.07.2009 Abfluss: 72,4 m³/s
| Date | Mean value [m³/s] | Maximum [m³/s] | Minimum [m³/s] |
|---|---|---|---|
| 31.12.2014 | 0.451 | 0.485 | 0.402 |
| 30.12.2014 | 0.402 | 0.402 | 0.402 |
| 29.12.2014 | 0.409 | 0.485 | 0.329 |
| 28.12.2014 | 0.505 | 0.578 | 0.485 |
| 27.12.2014 | 0.578 | 0.578 | 0.578 |
| 26.12.2014 | 0.584 | 0.678 | 0.578 |
| 25.12.2014 | 0.617 | 0.678 | 0.578 |
© Bayerisches Landesamt für Umwelt 2024