

Chart of year Piding / Stoißer Ache
Discharge from 29.03.2022 to 28.03.2023
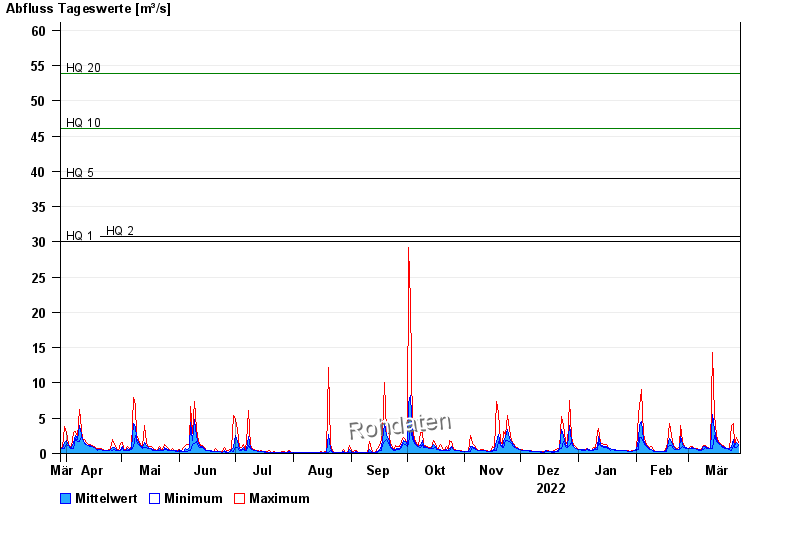
- HQ1 30 m³/s
- HQ2 30,8 m³/s
- HQ5 39 m³/s
- HQ10 46,1 m³/s
- HQ20 53,8 m³/s
- HQ50 66 m³/s
- HQ100 76,5 m³/s
| Date | Mean value [m³/s] | Maximum [m³/s] | Minimum [m³/s] |
|---|---|---|---|
| 28.03.2023 | 1.32 | 1.58 | 1.2 |
| 27.03.2023 | 1.56 | 2.31 | 0.884 |
| 26.03.2023 | 0.978 | 1.12 | 0.884 |
| 25.03.2023 | 1.94 | 4.23 | 1.12 |
| 24.03.2023 | 0.872 | 4.02 | 0.483 |
| 23.03.2023 | 0.639 | 0.67 | 0.575 |
| 22.03.2023 | 0.724 | 0.775 | 0.67 |
© Bayerisches Landesamt für Umwelt 2024