

Chart of year Piding / Stoißer Ache
Discharge from 20.10.2020 to 19.10.2021
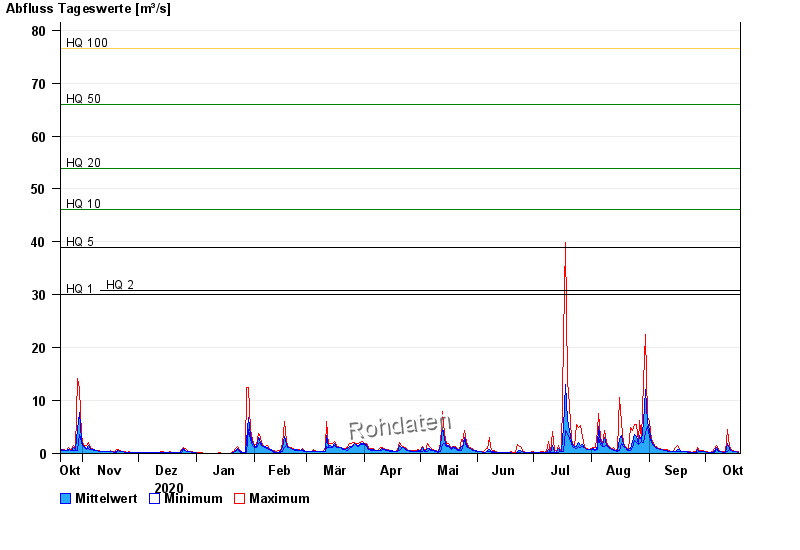
- HQ1 30 m³/s
- HQ2 30,8 m³/s
- HQ5 39 m³/s
- HQ10 46,1 m³/s
- HQ20 53,8 m³/s
- HQ50 66 m³/s
- HQ100 76,5 m³/s
| Date | Mean value [m³/s] | Maximum [m³/s] | Minimum [m³/s] |
|---|---|---|---|
| 19.10.2021 | 0.276 | 0.331 | 0.27 |
| 18.10.2021 | 0.331 | 0.331 | 0.331 |
| 17.10.2021 | 0.393 | 0.406 | 0.331 |
| 16.10.2021 | 0.466 | 0.497 | 0.406 |
| 15.10.2021 | 0.641 | 0.83 | 0.497 |
| 14.10.2021 | 0.951 | 1.35 | 0.713 |
| 13.10.2021 | 1.95 | 4.49 | 0.377 |
© Bayerisches Landesamt für Umwelt 2024