

Chart of year Piding / Stoißer Ache
Discharge from 18.09.2019 to 17.09.2020
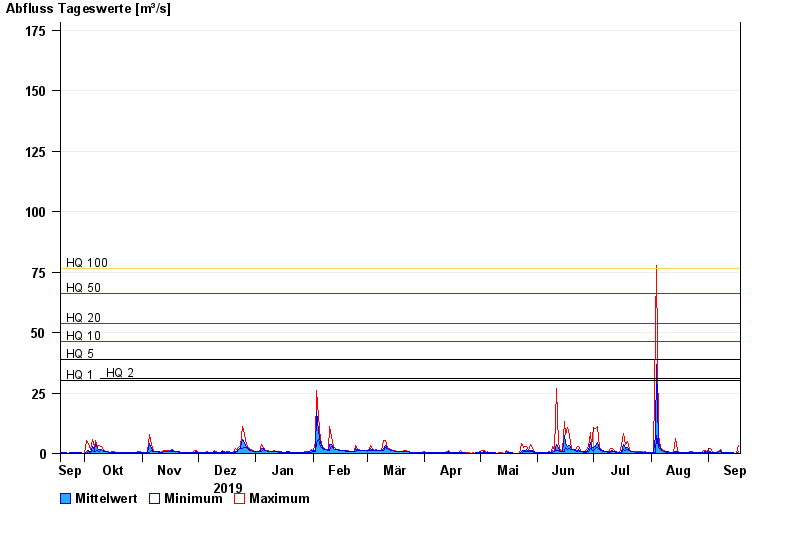
- HQ1 30 m³/s
- HQ2 30,8 m³/s
- HQ5 39 m³/s
- HQ10 46,1 m³/s
- HQ20 53,8 m³/s
- HQ50 66 m³/s
- HQ100 76,5 m³/s
| Date | Mean value [m³/s] | Maximum [m³/s] | Minimum [m³/s] |
|---|---|---|---|
| 17.09.2020 | 0.831 | 3.32 | 0.198 |
| 16.09.2020 | 0.197 | 0.198 | 0.196 |
| 15.09.2020 | 0.196 | 0.196 | 0.195 |
| 14.09.2020 | 0.213 | 0.231 | 0.195 |
| 13.09.2020 | 0.232 | 0.274 | 0.229 |
| 12.09.2020 | 0.256 | 0.272 | 0.229 |
| 11.09.2020 | 0.274 | 0.451 | 0.27 |
© Bayerisches Landesamt für Umwelt 2024