

Chart of year Piding / Stoißer Ache
Discharge from 01.01.2022 to 31.12.2022
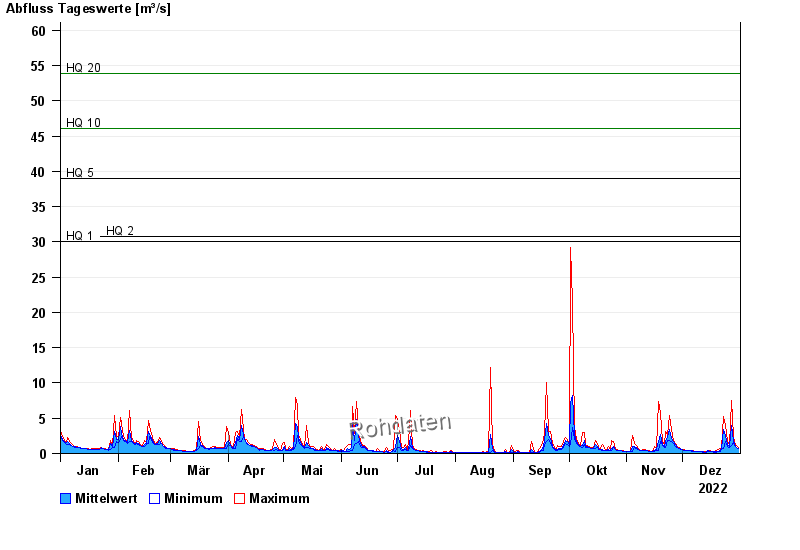
- HQ1 30 m³/s
- HQ2 30,8 m³/s
- HQ5 39 m³/s
- HQ10 46,1 m³/s
- HQ20 53,8 m³/s
- HQ50 66 m³/s
- HQ100 76,5 m³/s
| Date | Mean value [m³/s] | Maximum [m³/s] | Minimum [m³/s] |
|---|---|---|---|
| 31.12.2022 | 0.752 | 0.856 | 0.745 |
| 30.12.2022 | 0.92 | 1.1 | 0.856 |
| 29.12.2022 | 1.24 | 1.51 | 1.1 |
| 28.12.2022 | 1.85 | 2.47 | 1.51 |
| 27.12.2022 | 3.95 | 7.46 | 1.1 |
| 26.12.2022 | 0.925 | 1.1 | 0.856 |
| 25.12.2022 | 1.27 | 1.66 | 0.977 |
© Bayerisches Landesamt für Umwelt 2024