

Chart of year Piding / Stoißer Ache
Discharge from 01.01.2019 to 31.12.2019
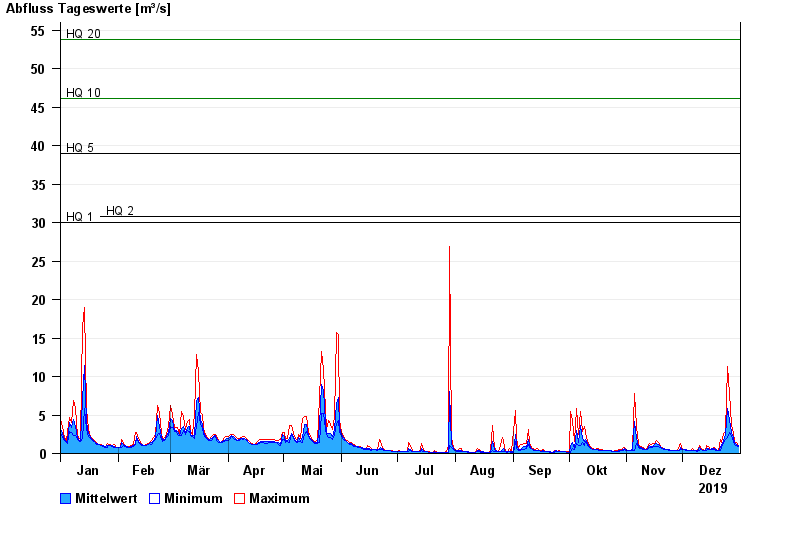
- HQ1 30 m³/s
- HQ2 30,8 m³/s
- HQ5 39 m³/s
- HQ10 46,1 m³/s
- HQ20 53,8 m³/s
- HQ50 66 m³/s
- HQ100 76,5 m³/s
| Date | Mean value [m³/s] | Maximum [m³/s] | Minimum [m³/s] |
|---|---|---|---|
| 31.12.2019 | 1 | 1.09 | 0.874 |
| 30.12.2019 | 1.14 | 1.46 | 1.09 |
| 29.12.2019 | 1.44 | 1.59 | 1.21 |
| 28.12.2019 | 2.04 | 2.67 | 1.59 |
| 27.12.2019 | 2.76 | 3.59 | 2.33 |
| 26.12.2019 | 4.29 | 7.83 | 2.67 |
| 25.12.2019 | 5.89 | 11.3 | 2.02 |
© Bayerisches Landesamt für Umwelt 2024