

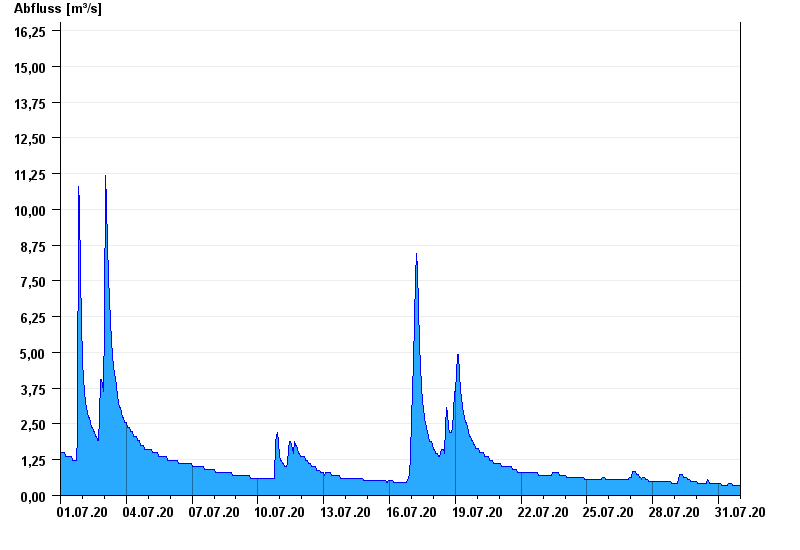
Chart of month Piding / Stoißer Ache
Discharge from 01.07.2020 to 31.07.2020
- 12.08.2002 Abfluss: 103 m³/s
- 08.07.1954 Abfluss: 86 m³/s
- 04.08.2020 Abfluss: 77,7 m³/s
- 26.06.1995 Abfluss: 77,6 m³/s
- 03.07.2009 Abfluss: 72,4 m³/s
| Date | Runoff [m³/s] |
|---|---|
| 01.08.2020 00:45 | 0.353 |
| 01.08.2020 00:30 | 0.353 |
| 01.08.2020 00:15 | 0.353 |
| 01.08.2020 00:00 | 0.353 |
| 31.07.2020 23:45 | 0.353 |
| 31.07.2020 23:30 | 0.353 |
| 31.07.2020 23:15 | 0.353 |
© Bayerisches Landesamt für Umwelt 2024