

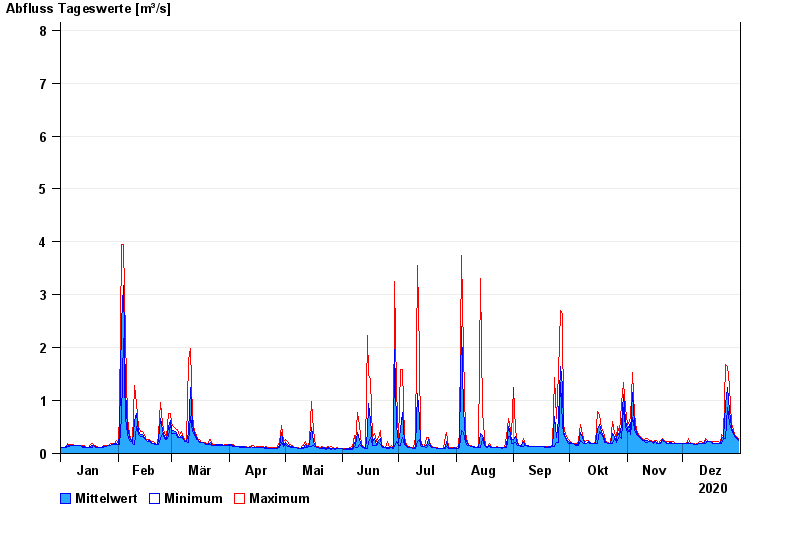
Chart of year Panzing / Bina
Discharge from 01.01.2020 to 31.12.2020
- HQ1 20 m³/s
- HQ2 28 m³/s
- HQ5 38 m³/s
- HQ10 46 m³/s
- HQ20 53 m³/s
- HQ50 64 m³/s
- HQ100 72 m³/s
| Date | Mean value [m³/s] | Maximum [m³/s] | Minimum [m³/s] |
|---|---|---|---|
| 31.12.2020 | 0.258 | 0.287 | 0.252 |
| 30.12.2020 | 0.296 | 0.324 | 0.286 |
| 29.12.2020 | 0.335 | 0.365 | 0.324 |
| 28.12.2020 | 0.403 | 0.456 | 0.365 |
| 27.12.2020 | 0.49 | 0.56 | 0.456 |
| 26.12.2020 | 0.815 | 1.27 | 0.56 |
| 25.12.2020 | 1.25 | 1.64 | 0.875 |
© Bayerisches Landesamt für Umwelt 2024