

Chart of year Mühltal / Glonn
Discharge from 26.06.2019 to 25.06.2020
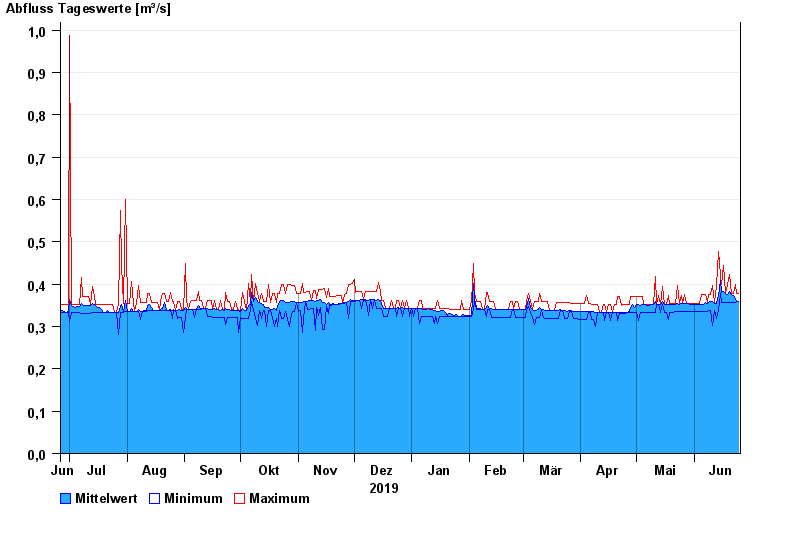
| Date | Mean value [m³/s] | Maximum [m³/s] | Minimum [m³/s] |
|---|---|---|---|
| 25.06.2020 | 0.359 | 0.378 | 0.358 |
| 24.06.2020 | 0.362 | 0.378 | 0.358 |
| 23.06.2020 | 0.363 | 0.399 | 0.357 |
| 22.06.2020 | 0.373 | 0.378 | 0.357 |
| 21.06.2020 | 0.376 | 0.378 | 0.357 |
| 20.06.2020 | 0.382 | 0.422 | 0.357 |
| 19.06.2020 | 0.376 | 0.399 | 0.357 |
© Bayerisches Landesamt für Umwelt 2024