

Chart of total period Moosburg / Isar
Discharge from 22.02.2020 to 04.05.2024
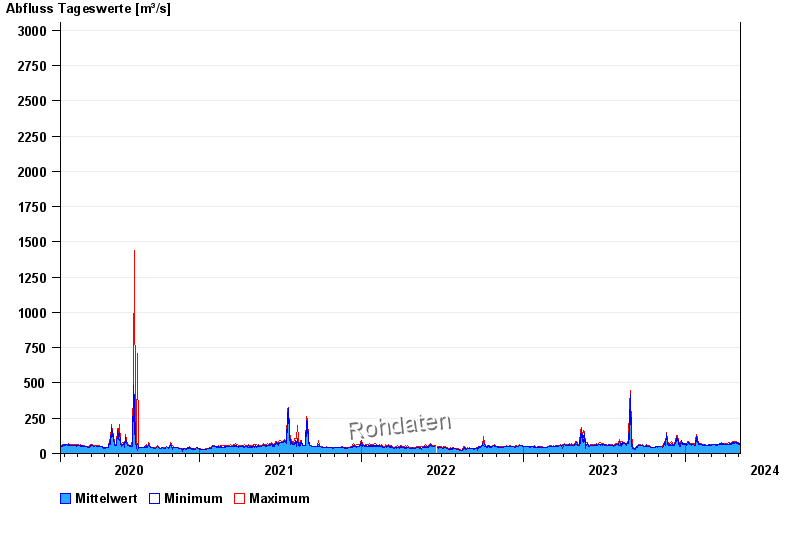 Für diesen Pegel sind keine Jährlichkeiten hinterlegt.
| Date | Mean value [m³/s] | Maximum [m³/s] | Minimum [m³/s] |
|---|---|---|---|
| 04.05.2024 | 67.6 | 70.7 | 66 |
| 03.05.2024 | 67.9 | 70.7 | 67.2 |
| 02.05.2024 | 68.4 | 70.7 | 66 |
| 01.05.2024 | 67 | 68.3 | 64.9 |
| 30.04.2024 | 68.7 | 76.6 | 66 |
| 29.04.2024 | 75.5 | 80.4 | 71.8 |
| 28.04.2024 | 71.7 | 79.1 | 68.3 |
© Bayerisches Landesamt für Umwelt 2024