

Chart of total period Lenggries / Isar
Discharge from 01.11.1949 to 29.04.2024
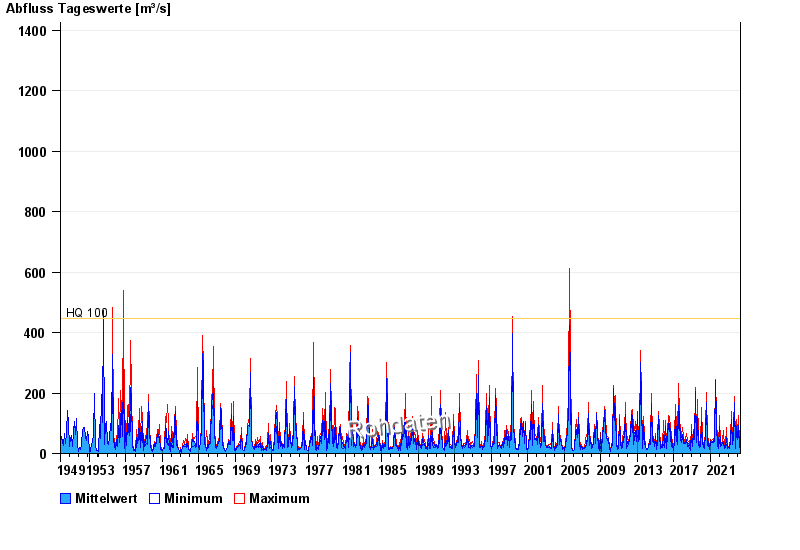
- HQ100 445 m³/s
| Date | Mean value [m³/s] | Maximum [m³/s] | Minimum [m³/s] |
|---|---|---|---|
| 29.04.2024 | 37.2 | 41.2 | 34.6 |
| 28.04.2024 | 36.5 | 42.1 | 32.3 |
| 27.04.2024 | 29.3 | 37 | 25.6 |
| 26.04.2024 | 24.3 | 27.8 | 23.5 |
| 25.04.2024 | 20.9 | 23.5 | 18.8 |
| 24.04.2024 | 19.6 | 20.7 | 19.4 |
| 23.04.2024 | 20.2 | 20.7 | 19.4 |
© Bayerisches Landesamt für Umwelt 2024